Price Volume Divergence Oscillator (PVDO)
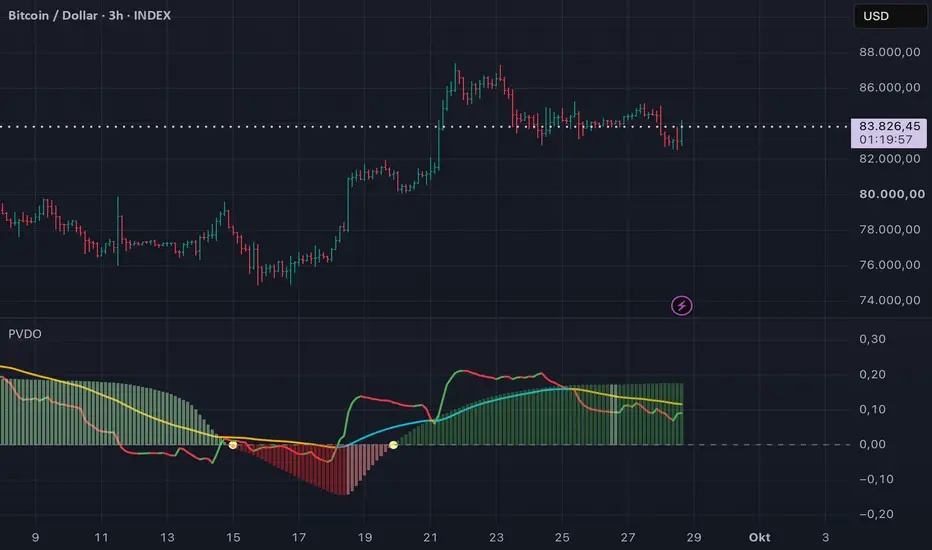
Price Volume Divergence Oscillator (PVDO)
Overview
PVDO is an open-source price-volume indicator designed to show whether price movement is being supported or contradicted by underlying volume pressure.
Instead of treating price and volume as separate signals, PVDO evaluates them together and expresses their relationship as a normalized oscillator. This makes it easier to see when price-volume conditions are aligned, diverging, strengthening, weakening, or moving back toward neutral.
PVDO is the foundation layer of the PVD Ecosystem. Its role is deliberately simple: describe the current price-volume imbalance as clearly and consistently as possible.
What it shows
PVDO is displayed in a separate pane.
• The main oscillator represents the current price-volume divergence state.
• The signal line provides a smoother reference for that state.
• The histogram highlights the difference between the two and helps show changes in pressure.
• Zero is the neutral reference between positive and negative price-volume conditions.
Positive values indicate that the current relationship is tilted toward positive pressure. Negative values indicate the opposite. Changes in distance from zero and changes relative to the signal line can help reveal strengthening, weakening, or shifting conditions.
How to use it
PVDO is best used as market context rather than as a standalone buy/sell system.
Typical uses include:
• checking whether price movement is supported by volume pressure;
• identifying changes in the balance between price and volume;
• comparing current pressure with its recent smoothed state;
• observing transitions through or away from neutral.
A positive or negative value is not, by itself, a trade instruction. The meaning of a reading depends on the instrument, timeframe, and surrounding market structure.
Role in the PVD Ecosystem
PVDO answers the basic PVD question:
What is the current relationship between price movement and volume pressure?
Within the PVD Ecosystem, this present-state information is the common analytical foundation. PVDO itself remains focused on the underlying imbalance rather than trying to perform state classification, momentum analysis, or forecasting at the same time.
Originality
PVDO uses an original implementation that combines normalized price movement and normalized volume pressure into a dedicated price-volume divergence state, followed by adaptive smoothing and stored-pressure processing.
The script is published open source so users can inspect its construction and understand how the displayed state is produced.
Limitations
PVDO does not predict certain future prices and does not guarantee that a positive or negative pressure state will continue.
The indicator depends on both price and volume data. On symbols where meaningful volume information is unavailable or differs materially between data feeds, results may be limited or differ from other markets.
Like all indicators, PVDO simplifies market information. It should be used together with market context, independent judgment, and appropriate risk management.
Overview
PVDO is an open-source price-volume indicator designed to show whether price movement is being supported or contradicted by underlying volume pressure.
Instead of treating price and volume as separate signals, PVDO evaluates them together and expresses their relationship as a normalized oscillator. This makes it easier to see when price-volume conditions are aligned, diverging, strengthening, weakening, or moving back toward neutral.
PVDO is the foundation layer of the PVD Ecosystem. Its role is deliberately simple: describe the current price-volume imbalance as clearly and consistently as possible.
What it shows
PVDO is displayed in a separate pane.
• The main oscillator represents the current price-volume divergence state.
• The signal line provides a smoother reference for that state.
• The histogram highlights the difference between the two and helps show changes in pressure.
• Zero is the neutral reference between positive and negative price-volume conditions.
Positive values indicate that the current relationship is tilted toward positive pressure. Negative values indicate the opposite. Changes in distance from zero and changes relative to the signal line can help reveal strengthening, weakening, or shifting conditions.
How to use it
PVDO is best used as market context rather than as a standalone buy/sell system.
Typical uses include:
• checking whether price movement is supported by volume pressure;
• identifying changes in the balance between price and volume;
• comparing current pressure with its recent smoothed state;
• observing transitions through or away from neutral.
A positive or negative value is not, by itself, a trade instruction. The meaning of a reading depends on the instrument, timeframe, and surrounding market structure.
Role in the PVD Ecosystem
PVDO answers the basic PVD question:
What is the current relationship between price movement and volume pressure?
Within the PVD Ecosystem, this present-state information is the common analytical foundation. PVDO itself remains focused on the underlying imbalance rather than trying to perform state classification, momentum analysis, or forecasting at the same time.
Originality
PVDO uses an original implementation that combines normalized price movement and normalized volume pressure into a dedicated price-volume divergence state, followed by adaptive smoothing and stored-pressure processing.
The script is published open source so users can inspect its construction and understand how the displayed state is produced.
Limitations
PVDO does not predict certain future prices and does not guarantee that a positive or negative pressure state will continue.
The indicator depends on both price and volume data. On symbols where meaningful volume information is unavailable or differs materially between data feeds, results may be limited or differ from other markets.
Like all indicators, PVDO simplifies market information. It should be used together with market context, independent judgment, and appropriate risk management.

Pernyataan Penyangkalan
Informasi dan publikasi ini tidak dimaksudkan, dan bukan merupakan, saran atau rekomendasi keuangan, investasi, trading, atau jenis lainnya yang diberikan atau didukung oleh TradingView. Baca selengkapnya di Ketentuan Penggunaan.
Pernyataan Penyangkalan
Informasi dan publikasi ini tidak dimaksudkan, dan bukan merupakan, saran atau rekomendasi keuangan, investasi, trading, atau jenis lainnya yang diberikan atau didukung oleh TradingView. Baca selengkapnya di Ketentuan Penggunaan.