OPEN-SOURCE SCRIPT
SteveFi Trade Cockpit
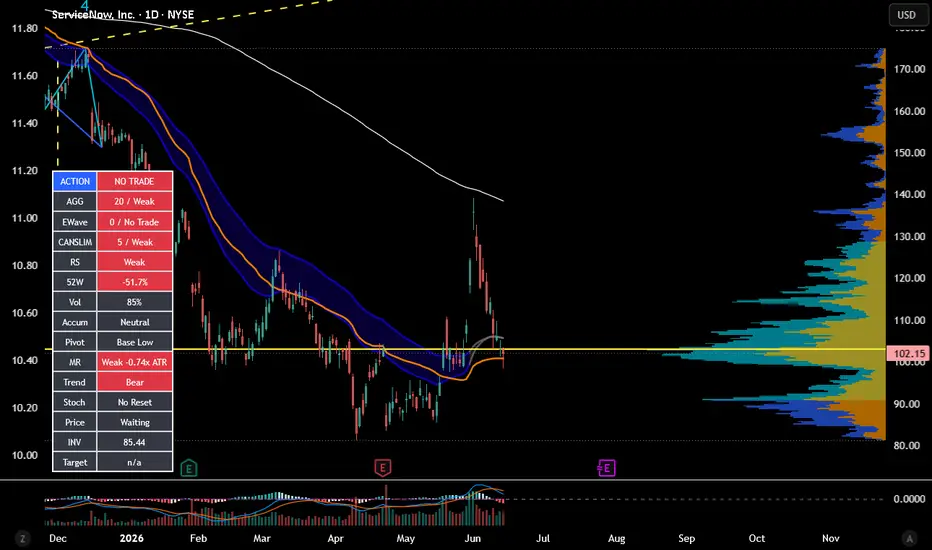
The dashboard has 15 rows:
| Row | Purpose |
| ----------- | ---------------------------------------------------- |
| **ACTION** | Final decision output |
| **AGG** | Weighted overall score using all 13 major attributes |
| **EWave** | Elliott/Wolfe/Stoch/RSI-style timing score |
| **CANSLIM** | CANSLIM-style technical quality score |
| **RS** | Relative strength vs QQQ |
| **52W** | Distance from 52-week high |
| **Vol** | Current volume vs average volume |
| **Accum** | Accumulation vs distribution pressure |
| **Pivot** | Whether price is near a breakout/pivot area |
| **MR** | Mean reversion / extension risk |
| **Trend** | Overall trend structure |
| **Stoch** | Momentum reset/exhaustion |
| **Price** | Price action confirmation |
| **INV** | Invalidation level |
| **Target** | Potential upside target |
The color coding is:
| Color | Meaning |
| ------------- | ---------------------------------------------- |
| **Green** | Positive / bullish |
| **Orange** | Watch / caution / constructive but not perfect |
| **Dark gray** | Neutral / waiting |
| **Red** | Negative / risk / failure |
---
# 1. ACTION
This is the **main output**.
Possible values:
| ACTION | Meaning |
| ------------------ | --------------------------------------------------------------------------------- |
| **BUY TRIGGER** | Aggregate score is strong, price confirms, not invalidated, and not too stretched |
| **BUY WATCH** | Setup is building, but not fully confirmed |
| **TRIM / CAUTION** | Momentum may be rolling over or price is stretched |
| **WAIT** | Some positives exist, but not enough for action |
| **NO TRADE** | Weak overall setup |
| **INV** | Invalidation level broke. Setup failed. |
The action row is based mostly on **AGG**, not just EWave.
Current logic:
```text
BUY TRIGGER =
AGG >= 80
AND Price is Confirmed
AND not invalidated
AND MR is not Stretched
```
If you turn on:
```text
Require CANSLIM Filter for BUY TRIGGER
```
Then BUY TRIGGER also requires a minimum CANSLIM-quality pass.
That is the stricter version.
---
# 2. AGG
**AGG** is the most important score now.
It is the weighted aggregate score based on all major dashboard factors. This is the “whole chart quality” score.
Current weighting:
| Attribute | Weight |
| ----------- | -----: |
| **CANSLIM** | 21% |
| **RS** | 13% |
| **Price** | 12% |
| **Trend** | 10% |
| **Pivot** | 10% |
| **52W** | 8% |
| **EWave** | 8% |
| **Vol** | 6% |
| **MR** | 5% |
| **Accum** | 3% |
| **Stoch** | 2% |
| **INV** | 1% |
| **Target** | 1% |
This weighting intentionally makes the dashboard **less wave-heavy**.
The thinking is:
> Great stocks with strong RS and confirmed price action matter more than a possible wave count.
AGG grades:
| AGG Score | Grade | Meaning |
| -----------: | ----- | ---------------------------------- |
| **85+** | A+ | Excellent |
| **80–84** | A | Strong / trigger zone if confirmed |
| **70–79** | B | Good watchlist setup |
| **60–69** | C | Developing but not there yet |
| **50–59** | D | Weak / wait |
| **Under 50** | Weak | No trade |
How I’d use it:
| AGG | Interpretation |
| -----------: | ------------------------------------------------- |
| **80+** | Potential action zone |
| **70–79** | Watch closely |
| **60–69** | Setup forming, still early |
| **Under 60** | Probably ignore unless you have a separate thesis |
---
# 3. EWave
**EWave** is the Elliott/Wolfe-style timing score.
It uses:
| EWave Component | Points |
| --------------------------------------------- | -----: |
| Bullish trend context | 20 |
| Fib pullback / possible Wave 2 or Wave 4 zone | 20 |
| RSI bullish divergence | 20 |
| Stoch reset | 15 |
| Wolfe-like structure | 10 |
| Price action confirmation | 10 |
Maximum is **95**.
Dashboard examples:
| EWave | Meaning |
| ----------------------- | ------------------------ |
| **75+ / A** | Strong wave/timing setup |
| **60–74 / B Watch** | Setup is building |
| **40–59 / C Early** | Early or incomplete |
| **Under 40 / No Trade** | Weak timing setup |
Important: **EWave is only 8% of AGG now.**
That means it helps with timing, but it does not dominate the decision.
Best interpretation:
> EWave tells you whether the pullback/structure/timing looks constructive.
It does **not** mean “this is definitely Wave 3.”
---
# 4. CANSLIM
**CANSLIM** is a technical approximation of CANSLIM-style stock quality.
It does not use IBD’s proprietary EPS, sales, or fund ownership data. TradingView cannot reliably recreate that from Pine.
Instead, it uses technical leadership proxies:
| CANSLIM Component | Points |
| ---------------------------- | -----: |
| RS vs benchmark | 20 |
| RS line near/new high | 15 |
| Distance from 52-week high | 15 |
| Volume vs average | 15 |
| Accumulation vs distribution | 15 |
| Pivot/base status | 20 |
Maximum is **100**.
Grades:
| CANSLIM Score | Grade | Meaning |
| ------------: | ----- | -------------------------------------- |
| **80+** | A | Strong CANSLIM-style technical profile |
| **65–79** | B | Good |
| **50–64** | C | Mixed |
| **Under 50** | Weak | Not acting like a leader |
This is now the **largest weight in AGG** at **21%**.
That’s intentional.
The dashboard is saying:
> Stock quality and leadership come first. Timing comes second.
---
# 5. RS
**RS** means relative strength versus the benchmark, currently defaulted to **QQQ**.
It compares the stock’s performance to QQQ over the selected lookback period.
Possible values:
| RS | Meaning |
| ---------- | ------------------------------------------------------------------------- |
| **Strong** | Stock is outperforming QQQ and its RS line is above its RS moving average |
| **OK** | Stock is outperforming QQQ, but not as strongly |
| **Weak** | Stock is underperforming QQQ |
Why this matters:
CANSLIM-style trading wants **leaders**, not laggards.
A stock with **RS Strong** is showing better demand than the market.
Best read:
| RS | Interpretation |
| ------------------ | ------------------------ |
| **Strong / green** | Good leader behavior |
| **OK / orange** | Acceptable but not elite |
| **Weak / red** | Caution |
---
# 6. 52W
**52W** shows how far the stock is from its 52-week high.
Example:
```text
-6.1%
```
Means the stock is 6.1% below its 52-week high.
Interpretation:
| 52W Distance | Meaning |
| ---------------: | ----------------- |
| **0% to -5%** | Very strong |
| **-5% to -15%** | Good / acceptable |
| **-15% to -25%** | Caution |
| **Below -25%** | Weak / damaged |
Why it matters:
CANSLIM usually prefers stocks near highs, not stocks buried far below highs.
A stock near highs is often showing institutional demand.
---
# 7. Vol
**Vol** shows current volume as a percentage of average volume.
Example:
```text
89%
```
Means current volume is 89% of the average volume.
Interpretation:
| Vol | Meaning |
| -------------- | --------------------------------------- |
| **140%+** | Strong demand / breakout-quality volume |
| **100–139%** | Decent |
| **Under 100%** | Light / not confirmed |
Why it matters:
A breakout or strong move is more convincing when volume expands.
For CANSLIM-style buying, strong volume gives confirmation that bigger buyers may be involved.
One note: on intraday bars or during the trading day, volume can look low until the day completes. On daily charts, interpret it best near/after the close.
---
# 8. Accum
**Accum** tries to detect whether the stock has more accumulation or distribution pressure.
It compares:
* Up days on above-average volume
* Down days on above-average volume
Possible values:
| Accum | Meaning |
| ----------- | ----------------------------------------------------- |
| **Accum** | More heavy-volume up days than heavy-volume down days |
| **Neutral** | No clear edge |
| **Distrib** | More heavy-volume down days than up days |
Why it matters:
CANSLIM cares about institutional accumulation.
A stock can look okay on price, but if it is under distribution, the setup is lower quality.
---
# 9. Pivot
**Pivot** tells you where price is relative to a recent breakout/base area.
It uses the recent high over the base lookback period as a rough pivot reference.
Possible values:
| Pivot | Meaning |
| --------------- | ---------------------------------------------- |
| **Breakout** | Price broke above pivot with strong volume |
| **Near Pivot** | Price is within about 5% below the pivot |
| **Above Pivot** | Price is above pivot, but volume is not strong |
| **Extended** | Price is more than about 5% above pivot |
| **Base Low** | Price is not near a useful pivot area |
Why it matters:
The best setups are often near proper buy areas.
For your dashboard:
| Pivot | Interpretation |
| ----------------------- | ------------------ |
| **Breakout / green** | Strong |
| **Near Pivot / orange** | Watch closely |
| **Extended / red** | Be careful chasing |
| **Base Low / gray** | Not actionable yet |
---
# 10. MR
**MR** means mean reversion / extension risk.
It measures how far price is from the fast EMA using ATR.
Example:
```text
Extended 1.73x ATR
```
Means price is 1.73 ATR above the fast EMA.
Possible values:
| MR | Meaning |
| ------------- | ---------------------------------------------------------- |
| **Discount** | Price pulled back below fast EMA but remains above mid EMA |
| **Normal** | Price is within normal range of fast EMA |
| **Extended** | Price is above normal range |
| **Stretched** | Price is too far extended |
| **Weak** | Price is below mid EMA |
| **n/a** | Not enough data |
Why this matters:
This row helps prevent chasing.
A stock can be strong but too extended for a fresh entry.
Important trigger rule:
```text
BUY TRIGGER cannot fire if MR = Stretched
```
That’s a guardrail.
Best read:
| MR | Interpretation |
| --------------------- | ------------------------ |
| **Discount / green** | Pullback zone |
| **Normal / neutral** | Healthy |
| **Extended / orange** | Be careful |
| **Stretched / red** | Probably not a fresh buy |
| **Weak / red** | Structure may be broken |
---
# 11. Trend
**Trend** gives the broader moving-average structure.
Possible values:
| Trend | Meaning |
| --------------- | ------------------------------------------------------------------- |
| **Bull Strong** | Price above mid EMA, fast EMA above mid EMA, mid EMA above long SMA |
| **Bull Basic** | Price and fast trend are above mid EMA |
| **Neutral** | Mixed |
| **Bear** | Price and averages are bearish |
This row is important because you generally want to buy pullbacks in strong trends, not fight broken charts.
Best setup:
```text
Trend = Bull Strong
```
---
# 12. Stoch
**Stoch** shows Stochastic momentum condition.
Possible values:
| Stoch | Meaning |
| ------------- | ------------------------------------------------------------ |
| **Reset** | Stoch recently got oversold/reset and is turning back up |
| **K>D** | Momentum is positive, but not necessarily from a fresh reset |
| **Roll Over** | Stoch was overbought and crossed down |
| **No Reset** | No useful signal |
Why this matters:
This came from the original HeidingOut-style method:
> Price action leads, Stoch/RSI confirm.
Best entry setup:
```text
Stoch = Reset
```
Caution setup:
```text
Stoch = Roll Over
```
But Stoch is only **2% of AGG** now because oscillators can be noisy.
---
# 13. Price
**Price** is one of the most important rows.
It checks whether price action has actually confirmed.
It requires:
* Higher-low structure
* Close above fast EMA
* Bullish candle
* Close above prior bar high
Possible values:
| Price | Meaning |
| ------------- | -------------------------------------------- |
| **Confirmed** | Price action supports the setup |
| **Waiting** | Setup may exist, but price has not confirmed |
This is weighted **12%** in AGG, which is high.
Why?
Because a setup without price confirmation is still just a possibility.
A BUY TRIGGER requires:
```text
Price = Confirmed
```
---
# 14. INV
**INV** is the invalidation level.
This is the key structural low from the detected impulse/pullback logic.
Plain English:
> If price closes below this level, the setup is probably broken.
Possible values:
| INV | Meaning |
| ----------- | --------------------------------- |
| Price level | Key invalidation reference |
| n/a | Not enough structure detected yet |
Important:
If price breaks below INV, ACTION becomes:
```text
INV
```
Invalidation overrides everything.
Even if RS is strong and CANSLIM is good, a broken structure means the setup has failed.
---
# 15. Target
**Target** shows the projected upside target and upside percentage.
It uses a **1.618 Fib extension** from the detected impulse.
Example:
```text
145.20 / +12.4%
```
Means:
* Potential target: 145.20
* Upside from current price: +12.4%
This is intentionally weighted only **1%** in AGG.
Why so low?
Because targets are estimates. Useful, but not reliable enough to drive the decision.
Use Target as:
> “Is there enough upside to justify the risk?”
Not as:
> “This will definitely go there.”
---
# How the AGG score thinks
The new AGG is intentionally biased toward objective leadership and confirmation.
Current hierarchy:
## Most important
* CANSLIM
* RS
* Price
* Trend
* Pivot
These answer:
> Is this a quality leader acting correctly?
## Middle importance
* 52W
* EWave
* Vol
* MR
These answer:
> Is it near highs, reasonably timed, supported by volume, and not too stretched?
## Lower importance
* Accum
* Stoch
* INV
* Target
These help, but do not dominate.
---
# How to read a good setup
A very good setup would look like:
| Row | Ideal |
| ------- | -------------------------- |
| ACTION | BUY TRIGGER |
| AGG | 80+ |
| EWave | 60+ |
| CANSLIM | 65+ |
| RS | Strong |
| 52W | Better than -15% |
| Vol | 100%+ or 140%+ on breakout |
| Accum | Accum |
| Pivot | Near Pivot or Breakout |
| MR | Normal or Discount |
| Trend | Bull Strong |
| Stoch | Reset or K>D |
| Price | Confirmed |
| INV | Below nearby structure |
| Target | Positive upside |
That is the kind of dashboard that says:
> This is worth real attention.
---
# How to read your ALAB screenshot
From your screenshot, the dashboard looked roughly like:
| Row | Reading |
| ------- | ------------------ |
| ACTION | WAIT |
| EWave | 40 / C Early |
| CANSLIM | 57 / C |
| RS | Strong |
| 52W | -6.1% |
| Vol | 89% |
| Accum | Accum |
| Pivot | Near Pivot |
| MR | Extended 1.73x ATR |
| Trend | Bull Strong |
| Stoch | K>D |
| Price | Waiting |
| Target | n/a |
That says:
**Good stock. Strong RS. Near highs. In a bullish trend. But not confirmed yet, volume is light, and price is a little extended.**
So **WAIT** makes sense.
It is not saying “bad stock.”
It is saying:
> Good candidate, but not a clean entry yet.
---
# The key dashboard philosophy
This is now the right structure:
## CANSLIM finds the leader
Rows:
* CANSLIM
* RS
* 52W
* Vol
* Accum
* Pivot
## EWave helps timing
Rows:
* EWave
* Stoch
* Price
* MR
## Risk/reward controls the trade
Rows:
* INV
* Target
* MR
## AGG combines it all
AGG answers:
> Overall, is this setup strong enough to act on?
---
# My simple decision rules
Use it like this:
## BUY TRIGGER
Only consider buying when:
* ACTION = BUY TRIGGER
* AGG is 80+
* Price is Confirmed
* MR is not Stretched
* INV is clear
* Target gives enough upside
## BUY WATCH
Put on watchlist when:
* ACTION = BUY WATCH
* RS is Strong
* CANSLIM is at least C/B
* Pivot is Near Pivot
* Price is Waiting
## WAIT
Do nothing when:
* Stock is good, but price is not confirmed
* MR is extended
* Volume is not there
* EWave is early
## TRIM / CAUTION
Consider trimming when:
* Stoch rolls over
* MR becomes Stretched
* Price action weakens after a run
## INV
Respect it.
If INV triggers, the setup is broken. Reassess from scratch.
| Row | Purpose |
| ----------- | ---------------------------------------------------- |
| **ACTION** | Final decision output |
| **AGG** | Weighted overall score using all 13 major attributes |
| **EWave** | Elliott/Wolfe/Stoch/RSI-style timing score |
| **CANSLIM** | CANSLIM-style technical quality score |
| **RS** | Relative strength vs QQQ |
| **52W** | Distance from 52-week high |
| **Vol** | Current volume vs average volume |
| **Accum** | Accumulation vs distribution pressure |
| **Pivot** | Whether price is near a breakout/pivot area |
| **MR** | Mean reversion / extension risk |
| **Trend** | Overall trend structure |
| **Stoch** | Momentum reset/exhaustion |
| **Price** | Price action confirmation |
| **INV** | Invalidation level |
| **Target** | Potential upside target |
The color coding is:
| Color | Meaning |
| ------------- | ---------------------------------------------- |
| **Green** | Positive / bullish |
| **Orange** | Watch / caution / constructive but not perfect |
| **Dark gray** | Neutral / waiting |
| **Red** | Negative / risk / failure |
---
# 1. ACTION
This is the **main output**.
Possible values:
| ACTION | Meaning |
| ------------------ | --------------------------------------------------------------------------------- |
| **BUY TRIGGER** | Aggregate score is strong, price confirms, not invalidated, and not too stretched |
| **BUY WATCH** | Setup is building, but not fully confirmed |
| **TRIM / CAUTION** | Momentum may be rolling over or price is stretched |
| **WAIT** | Some positives exist, but not enough for action |
| **NO TRADE** | Weak overall setup |
| **INV** | Invalidation level broke. Setup failed. |
The action row is based mostly on **AGG**, not just EWave.
Current logic:
```text
BUY TRIGGER =
AGG >= 80
AND Price is Confirmed
AND not invalidated
AND MR is not Stretched
```
If you turn on:
```text
Require CANSLIM Filter for BUY TRIGGER
```
Then BUY TRIGGER also requires a minimum CANSLIM-quality pass.
That is the stricter version.
---
# 2. AGG
**AGG** is the most important score now.
It is the weighted aggregate score based on all major dashboard factors. This is the “whole chart quality” score.
Current weighting:
| Attribute | Weight |
| ----------- | -----: |
| **CANSLIM** | 21% |
| **RS** | 13% |
| **Price** | 12% |
| **Trend** | 10% |
| **Pivot** | 10% |
| **52W** | 8% |
| **EWave** | 8% |
| **Vol** | 6% |
| **MR** | 5% |
| **Accum** | 3% |
| **Stoch** | 2% |
| **INV** | 1% |
| **Target** | 1% |
This weighting intentionally makes the dashboard **less wave-heavy**.
The thinking is:
> Great stocks with strong RS and confirmed price action matter more than a possible wave count.
AGG grades:
| AGG Score | Grade | Meaning |
| -----------: | ----- | ---------------------------------- |
| **85+** | A+ | Excellent |
| **80–84** | A | Strong / trigger zone if confirmed |
| **70–79** | B | Good watchlist setup |
| **60–69** | C | Developing but not there yet |
| **50–59** | D | Weak / wait |
| **Under 50** | Weak | No trade |
How I’d use it:
| AGG | Interpretation |
| -----------: | ------------------------------------------------- |
| **80+** | Potential action zone |
| **70–79** | Watch closely |
| **60–69** | Setup forming, still early |
| **Under 60** | Probably ignore unless you have a separate thesis |
---
# 3. EWave
**EWave** is the Elliott/Wolfe-style timing score.
It uses:
| EWave Component | Points |
| --------------------------------------------- | -----: |
| Bullish trend context | 20 |
| Fib pullback / possible Wave 2 or Wave 4 zone | 20 |
| RSI bullish divergence | 20 |
| Stoch reset | 15 |
| Wolfe-like structure | 10 |
| Price action confirmation | 10 |
Maximum is **95**.
Dashboard examples:
| EWave | Meaning |
| ----------------------- | ------------------------ |
| **75+ / A** | Strong wave/timing setup |
| **60–74 / B Watch** | Setup is building |
| **40–59 / C Early** | Early or incomplete |
| **Under 40 / No Trade** | Weak timing setup |
Important: **EWave is only 8% of AGG now.**
That means it helps with timing, but it does not dominate the decision.
Best interpretation:
> EWave tells you whether the pullback/structure/timing looks constructive.
It does **not** mean “this is definitely Wave 3.”
---
# 4. CANSLIM
**CANSLIM** is a technical approximation of CANSLIM-style stock quality.
It does not use IBD’s proprietary EPS, sales, or fund ownership data. TradingView cannot reliably recreate that from Pine.
Instead, it uses technical leadership proxies:
| CANSLIM Component | Points |
| ---------------------------- | -----: |
| RS vs benchmark | 20 |
| RS line near/new high | 15 |
| Distance from 52-week high | 15 |
| Volume vs average | 15 |
| Accumulation vs distribution | 15 |
| Pivot/base status | 20 |
Maximum is **100**.
Grades:
| CANSLIM Score | Grade | Meaning |
| ------------: | ----- | -------------------------------------- |
| **80+** | A | Strong CANSLIM-style technical profile |
| **65–79** | B | Good |
| **50–64** | C | Mixed |
| **Under 50** | Weak | Not acting like a leader |
This is now the **largest weight in AGG** at **21%**.
That’s intentional.
The dashboard is saying:
> Stock quality and leadership come first. Timing comes second.
---
# 5. RS
**RS** means relative strength versus the benchmark, currently defaulted to **QQQ**.
It compares the stock’s performance to QQQ over the selected lookback period.
Possible values:
| RS | Meaning |
| ---------- | ------------------------------------------------------------------------- |
| **Strong** | Stock is outperforming QQQ and its RS line is above its RS moving average |
| **OK** | Stock is outperforming QQQ, but not as strongly |
| **Weak** | Stock is underperforming QQQ |
Why this matters:
CANSLIM-style trading wants **leaders**, not laggards.
A stock with **RS Strong** is showing better demand than the market.
Best read:
| RS | Interpretation |
| ------------------ | ------------------------ |
| **Strong / green** | Good leader behavior |
| **OK / orange** | Acceptable but not elite |
| **Weak / red** | Caution |
---
# 6. 52W
**52W** shows how far the stock is from its 52-week high.
Example:
```text
-6.1%
```
Means the stock is 6.1% below its 52-week high.
Interpretation:
| 52W Distance | Meaning |
| ---------------: | ----------------- |
| **0% to -5%** | Very strong |
| **-5% to -15%** | Good / acceptable |
| **-15% to -25%** | Caution |
| **Below -25%** | Weak / damaged |
Why it matters:
CANSLIM usually prefers stocks near highs, not stocks buried far below highs.
A stock near highs is often showing institutional demand.
---
# 7. Vol
**Vol** shows current volume as a percentage of average volume.
Example:
```text
89%
```
Means current volume is 89% of the average volume.
Interpretation:
| Vol | Meaning |
| -------------- | --------------------------------------- |
| **140%+** | Strong demand / breakout-quality volume |
| **100–139%** | Decent |
| **Under 100%** | Light / not confirmed |
Why it matters:
A breakout or strong move is more convincing when volume expands.
For CANSLIM-style buying, strong volume gives confirmation that bigger buyers may be involved.
One note: on intraday bars or during the trading day, volume can look low until the day completes. On daily charts, interpret it best near/after the close.
---
# 8. Accum
**Accum** tries to detect whether the stock has more accumulation or distribution pressure.
It compares:
* Up days on above-average volume
* Down days on above-average volume
Possible values:
| Accum | Meaning |
| ----------- | ----------------------------------------------------- |
| **Accum** | More heavy-volume up days than heavy-volume down days |
| **Neutral** | No clear edge |
| **Distrib** | More heavy-volume down days than up days |
Why it matters:
CANSLIM cares about institutional accumulation.
A stock can look okay on price, but if it is under distribution, the setup is lower quality.
---
# 9. Pivot
**Pivot** tells you where price is relative to a recent breakout/base area.
It uses the recent high over the base lookback period as a rough pivot reference.
Possible values:
| Pivot | Meaning |
| --------------- | ---------------------------------------------- |
| **Breakout** | Price broke above pivot with strong volume |
| **Near Pivot** | Price is within about 5% below the pivot |
| **Above Pivot** | Price is above pivot, but volume is not strong |
| **Extended** | Price is more than about 5% above pivot |
| **Base Low** | Price is not near a useful pivot area |
Why it matters:
The best setups are often near proper buy areas.
For your dashboard:
| Pivot | Interpretation |
| ----------------------- | ------------------ |
| **Breakout / green** | Strong |
| **Near Pivot / orange** | Watch closely |
| **Extended / red** | Be careful chasing |
| **Base Low / gray** | Not actionable yet |
---
# 10. MR
**MR** means mean reversion / extension risk.
It measures how far price is from the fast EMA using ATR.
Example:
```text
Extended 1.73x ATR
```
Means price is 1.73 ATR above the fast EMA.
Possible values:
| MR | Meaning |
| ------------- | ---------------------------------------------------------- |
| **Discount** | Price pulled back below fast EMA but remains above mid EMA |
| **Normal** | Price is within normal range of fast EMA |
| **Extended** | Price is above normal range |
| **Stretched** | Price is too far extended |
| **Weak** | Price is below mid EMA |
| **n/a** | Not enough data |
Why this matters:
This row helps prevent chasing.
A stock can be strong but too extended for a fresh entry.
Important trigger rule:
```text
BUY TRIGGER cannot fire if MR = Stretched
```
That’s a guardrail.
Best read:
| MR | Interpretation |
| --------------------- | ------------------------ |
| **Discount / green** | Pullback zone |
| **Normal / neutral** | Healthy |
| **Extended / orange** | Be careful |
| **Stretched / red** | Probably not a fresh buy |
| **Weak / red** | Structure may be broken |
---
# 11. Trend
**Trend** gives the broader moving-average structure.
Possible values:
| Trend | Meaning |
| --------------- | ------------------------------------------------------------------- |
| **Bull Strong** | Price above mid EMA, fast EMA above mid EMA, mid EMA above long SMA |
| **Bull Basic** | Price and fast trend are above mid EMA |
| **Neutral** | Mixed |
| **Bear** | Price and averages are bearish |
This row is important because you generally want to buy pullbacks in strong trends, not fight broken charts.
Best setup:
```text
Trend = Bull Strong
```
---
# 12. Stoch
**Stoch** shows Stochastic momentum condition.
Possible values:
| Stoch | Meaning |
| ------------- | ------------------------------------------------------------ |
| **Reset** | Stoch recently got oversold/reset and is turning back up |
| **K>D** | Momentum is positive, but not necessarily from a fresh reset |
| **Roll Over** | Stoch was overbought and crossed down |
| **No Reset** | No useful signal |
Why this matters:
This came from the original HeidingOut-style method:
> Price action leads, Stoch/RSI confirm.
Best entry setup:
```text
Stoch = Reset
```
Caution setup:
```text
Stoch = Roll Over
```
But Stoch is only **2% of AGG** now because oscillators can be noisy.
---
# 13. Price
**Price** is one of the most important rows.
It checks whether price action has actually confirmed.
It requires:
* Higher-low structure
* Close above fast EMA
* Bullish candle
* Close above prior bar high
Possible values:
| Price | Meaning |
| ------------- | -------------------------------------------- |
| **Confirmed** | Price action supports the setup |
| **Waiting** | Setup may exist, but price has not confirmed |
This is weighted **12%** in AGG, which is high.
Why?
Because a setup without price confirmation is still just a possibility.
A BUY TRIGGER requires:
```text
Price = Confirmed
```
---
# 14. INV
**INV** is the invalidation level.
This is the key structural low from the detected impulse/pullback logic.
Plain English:
> If price closes below this level, the setup is probably broken.
Possible values:
| INV | Meaning |
| ----------- | --------------------------------- |
| Price level | Key invalidation reference |
| n/a | Not enough structure detected yet |
Important:
If price breaks below INV, ACTION becomes:
```text
INV
```
Invalidation overrides everything.
Even if RS is strong and CANSLIM is good, a broken structure means the setup has failed.
---
# 15. Target
**Target** shows the projected upside target and upside percentage.
It uses a **1.618 Fib extension** from the detected impulse.
Example:
```text
145.20 / +12.4%
```
Means:
* Potential target: 145.20
* Upside from current price: +12.4%
This is intentionally weighted only **1%** in AGG.
Why so low?
Because targets are estimates. Useful, but not reliable enough to drive the decision.
Use Target as:
> “Is there enough upside to justify the risk?”
Not as:
> “This will definitely go there.”
---
# How the AGG score thinks
The new AGG is intentionally biased toward objective leadership and confirmation.
Current hierarchy:
## Most important
* CANSLIM
* RS
* Price
* Trend
* Pivot
These answer:
> Is this a quality leader acting correctly?
## Middle importance
* 52W
* EWave
* Vol
* MR
These answer:
> Is it near highs, reasonably timed, supported by volume, and not too stretched?
## Lower importance
* Accum
* Stoch
* INV
* Target
These help, but do not dominate.
---
# How to read a good setup
A very good setup would look like:
| Row | Ideal |
| ------- | -------------------------- |
| ACTION | BUY TRIGGER |
| AGG | 80+ |
| EWave | 60+ |
| CANSLIM | 65+ |
| RS | Strong |
| 52W | Better than -15% |
| Vol | 100%+ or 140%+ on breakout |
| Accum | Accum |
| Pivot | Near Pivot or Breakout |
| MR | Normal or Discount |
| Trend | Bull Strong |
| Stoch | Reset or K>D |
| Price | Confirmed |
| INV | Below nearby structure |
| Target | Positive upside |
That is the kind of dashboard that says:
> This is worth real attention.
---
# How to read your ALAB screenshot
From your screenshot, the dashboard looked roughly like:
| Row | Reading |
| ------- | ------------------ |
| ACTION | WAIT |
| EWave | 40 / C Early |
| CANSLIM | 57 / C |
| RS | Strong |
| 52W | -6.1% |
| Vol | 89% |
| Accum | Accum |
| Pivot | Near Pivot |
| MR | Extended 1.73x ATR |
| Trend | Bull Strong |
| Stoch | K>D |
| Price | Waiting |
| Target | n/a |
That says:
**Good stock. Strong RS. Near highs. In a bullish trend. But not confirmed yet, volume is light, and price is a little extended.**
So **WAIT** makes sense.
It is not saying “bad stock.”
It is saying:
> Good candidate, but not a clean entry yet.
---
# The key dashboard philosophy
This is now the right structure:
## CANSLIM finds the leader
Rows:
* CANSLIM
* RS
* 52W
* Vol
* Accum
* Pivot
## EWave helps timing
Rows:
* EWave
* Stoch
* Price
* MR
## Risk/reward controls the trade
Rows:
* INV
* Target
* MR
## AGG combines it all
AGG answers:
> Overall, is this setup strong enough to act on?
---
# My simple decision rules
Use it like this:
## BUY TRIGGER
Only consider buying when:
* ACTION = BUY TRIGGER
* AGG is 80+
* Price is Confirmed
* MR is not Stretched
* INV is clear
* Target gives enough upside
## BUY WATCH
Put on watchlist when:
* ACTION = BUY WATCH
* RS is Strong
* CANSLIM is at least C/B
* Pivot is Near Pivot
* Price is Waiting
## WAIT
Do nothing when:
* Stock is good, but price is not confirmed
* MR is extended
* Volume is not there
* EWave is early
## TRIM / CAUTION
Consider trimming when:
* Stoch rolls over
* MR becomes Stretched
* Price action weakens after a run
## INV
Respect it.
If INV triggers, the setup is broken. Reassess from scratch.
Skrip open-source
Dengan semangat TradingView yang sesungguhnya, pembuat skrip ini telah menjadikannya sebagai sumber terbuka, sehingga para trader dapat meninjau dan memverifikasi fungsinya. Salut untuk penulisnya! Meskipun Anda dapat menggunakannya secara gratis, perlu diingat bahwa penerbitan ulang kode ini tunduk pada Tata Tertib kami.

Pernyataan Penyangkalan
Informasi dan publikasi ini tidak dimaksudkan, dan bukan merupakan, saran atau rekomendasi keuangan, investasi, trading, atau jenis lainnya yang diberikan atau didukung oleh TradingView. Baca selengkapnya di Ketentuan Penggunaan.
Skrip open-source
Dengan semangat TradingView yang sesungguhnya, pembuat skrip ini telah menjadikannya sebagai sumber terbuka, sehingga para trader dapat meninjau dan memverifikasi fungsinya. Salut untuk penulisnya! Meskipun Anda dapat menggunakannya secara gratis, perlu diingat bahwa penerbitan ulang kode ini tunduk pada Tata Tertib kami.
Pernyataan Penyangkalan
Informasi dan publikasi ini tidak dimaksudkan, dan bukan merupakan, saran atau rekomendasi keuangan, investasi, trading, atau jenis lainnya yang diberikan atau didukung oleh TradingView. Baca selengkapnya di Ketentuan Penggunaan.