HalfTrend Fractal Breakout Engine [BigBeluga]
More exclusive indicators from BigBeluga
Subscribe to BigBeluga Premium for $66.47/month to get exclusive indicators by this author. You pay right on TradingView and can use them on your charts straight away.
Explore BigBeluga Premium🔵 OVERVIEW
🔵 HOW IT WORKS
🔵 HOW TO READ THE "X" SCORE
🔵 HOW TO USE
🔵 NOTES
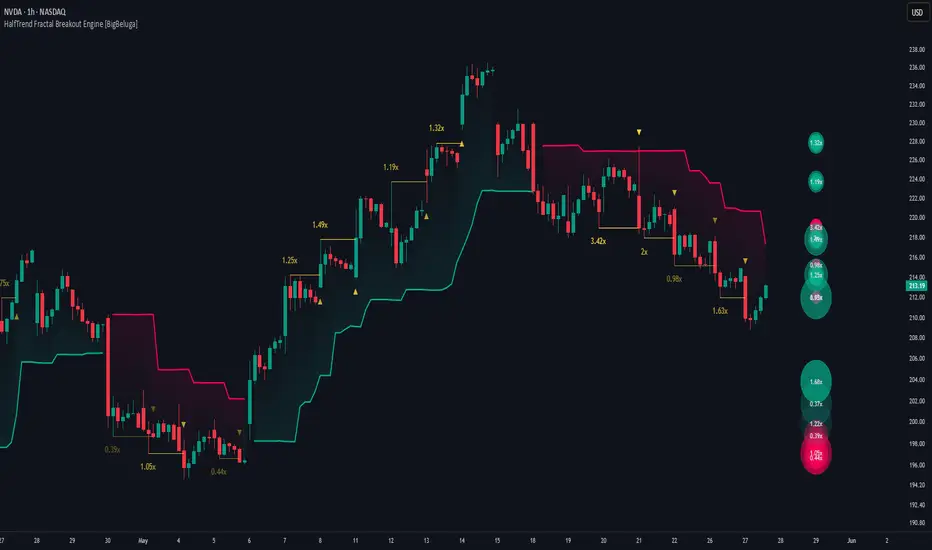
HalfTrend Fractal Breakout Engine [BigBeluga] is an indicator that combines the HalfTrend trend baseline with Williams fractal breakouts and volume-weighted pulse rings. It solves the problem of unqualified breakout signals by grading every fractal break with a volume multiple, a gradient color, and an expanding ring pulse — so strong breakouts visually stand out from weak ones.
Credits: The HalfTrend core logic — including the Amplitude and Channel Deviation baseline, the trend state machine, and the ATR bands — is adapted from the original HalfTrend indicator by Everget:
tradingview.com/script/U1SJ8ubc-HalfTrend-everget/
All breakout logic, volume grading, and pulse ring visuals, built on top of Everget's HalfTrend core.
🔵 HOW IT WORKS
The indicator runs a trend baseline, detects fractal breakouts, and scores each one against recent breakout volume:
1 — HalfTrend Baseline
- Amplitude Swing Detection: Uses the Amplitude window to locate minor swing highs and lows that drive the trend state machine.
- ATR Channel Deviation: Bands are built around the baseline using ATR scaled by the Channel Deviation multiplier.
- Trend Regime: A close above the upper band sets an uptrend, a close below the lower band sets a downtrend, and the dynamic band and fill recolor accordingly.
2 — Fractal Breakout Detection
- Williams Fractals: A 5-bar fractal pattern identifies confirmed structural tops and bottoms, offset 2 bars back.
- Breakout Trigger: In an uptrend, a close above a pending top fractal fires a bullish breakout; in a downtrend, a close below a pending bottom fractal fires a bearish breakout.
- Level Lines & Arrows: A horizontal line is drawn at the broken fractal, with a directional arrow printed at the breakout bar.
3 — Volume Scoring
- Rolling Window: Compares the breakout bar's volume against the max and average of the last Max Breakout History breakouts (default 10) stored in the current trend leg.
- Gradient Brightness: Color intensity scales with volume relative to the largest stored breakout, so the strongest breakouts glow brightest.
- Label Multiplier: A label shows breakout volume as a multiple of the stored average, like 1.85x.
- Array Reset on Flips: Volume history resets at each trend flip so every leg builds its own baseline.
4 — Pulse Rings
- Expanding Rings: Each breakout spawns Rings per Breakout circles that bloom outward and fade over Ring Duration bars.
- Strength-Based Size: Stronger breakouts produce larger, brighter rings while weak ones stay small and faint.
- Center Label: A centered label at each pulse cluster shows the breakout's volume multiple with a full-volume tooltip.
🔵 HOW TO READ THE "X" SCORE
The x label next to each breakout measures that bar's volume against a rolling window of the last breakouts stored in the current trend leg — by default, the previous 10 breakouts, controlled by Max Breakout History.
- 1.00x — volume matched the average of the stored breakouts. A neutral breakout with no unusual participation.
- 1.50x — 50% above the stored average. Moderate confirmation, noticeable but not exceptional.
- 2.00x — double the stored average. A strong breakout backed by clearly above-average volume.
- 3.00x and above — exceptional participation. These breakouts typically stand out visually with bright colors and large, bold rings.
- Below 1.00x — volume was below the stored average. A weak breakout that may be more prone to failure or fakeouts.
How the score is calculated:
- Label (x multiple): breakout volume ÷ average of stored breakouts — answers "how does this breakout compare to recent ones in this trend leg?"
- Gradient brightness: breakout volume ÷ max of stored breakouts — the largest stored breakout reaches full color intensity, and others scale down from there.
- Ring intensity: Uses the same ratio as gradient brightness, so the strongest breakout in the window produces the biggest and brightest pulse rings.
- Rolling Window: The stored list holds up to Max Breakout History breakouts (default 10). Older entries are dropped as new ones arrive, and the entire list resets on a trend flip.
Example: If the last 10 stored breakouts averaged 1,000 volume and the current breakout prints 2,400:
- Label reads 2.40x — the breakout was 2.4 times the recent average
- If the largest of those 10 was 1,500, brightness and ring intensity are capped at full (2,400 ÷ 1,500 = 1.6, clamped to 1.0)
🔵 HOW TO USE
Beyond standard breakout signals, the indicator can be applied in several ways:
- Trade Confirmed Breakouts: Enter in the direction of a fractal break once a bar closes beyond the level.
- Grade Breakout Strength: Use the x multiple and ring brightness to compare breaks — higher values indicate stronger participation.
- Read Trend Regime: Use the dynamic band color and fill to see whether the market is in an uptrend or downtrend.
- Spot Weak vs Strong Breaks: Faint, small rings and low multipliers signal weak breaks that may be more prone to failure.
- Customize the Visuals: Adjust ring count, duration, offset, and colors to match your chart style.
🔵 NOTES
Why this implementation is unique:
- Combines the HalfTrend baseline with Williams fractal breakouts, so signals fire at confirmed structural levels rather than arbitrary crossings.
- Volume is scored against a rolling window of recent breakouts in the same trend leg, keeping labels stable and avoiding self-referential distortion.
- Pulse rings and gradient coloring translate volume strength into an instantly readable visual — no separate panel required.
- Fully customizable amplitude, deviation, history window, colors, and ring behavior to match any market or timeframe.

🌐 bigbeluga.org/tv - Get access to our powerful tools & indicators.
🔵 Learn More -> docs.bigbeluga.org/
🔵 Join Discord -> go.bigbeluga.org/k65q9bfqfu
All content provided by BigBeluga is for educational purposes only
🔵 Learn More -> docs.bigbeluga.org/
🔵 Join Discord -> go.bigbeluga.org/k65q9bfqfu
All content provided by BigBeluga is for educational purposes only
Pernyataan Penyangkalan
Informasi dan publikasi ini tidak dimaksudkan, dan bukan merupakan, saran atau rekomendasi keuangan, investasi, trading, atau jenis lainnya yang diberikan atau didukung oleh TradingView. Baca selengkapnya di Ketentuan Penggunaan.
🌐 bigbeluga.org/tv - Get access to our powerful tools & indicators.
🔵 Learn More -> docs.bigbeluga.org/
🔵 Join Discord -> go.bigbeluga.org/k65q9bfqfu
All content provided by BigBeluga is for educational purposes only
🔵 Learn More -> docs.bigbeluga.org/
🔵 Join Discord -> go.bigbeluga.org/k65q9bfqfu
All content provided by BigBeluga is for educational purposes only
Pernyataan Penyangkalan
Informasi dan publikasi ini tidak dimaksudkan, dan bukan merupakan, saran atau rekomendasi keuangan, investasi, trading, atau jenis lainnya yang diberikan atau didukung oleh TradingView. Baca selengkapnya di Ketentuan Penggunaan.