OPEN-SOURCE SCRIPT
Quantum Scanner Equalizer [Point algo]
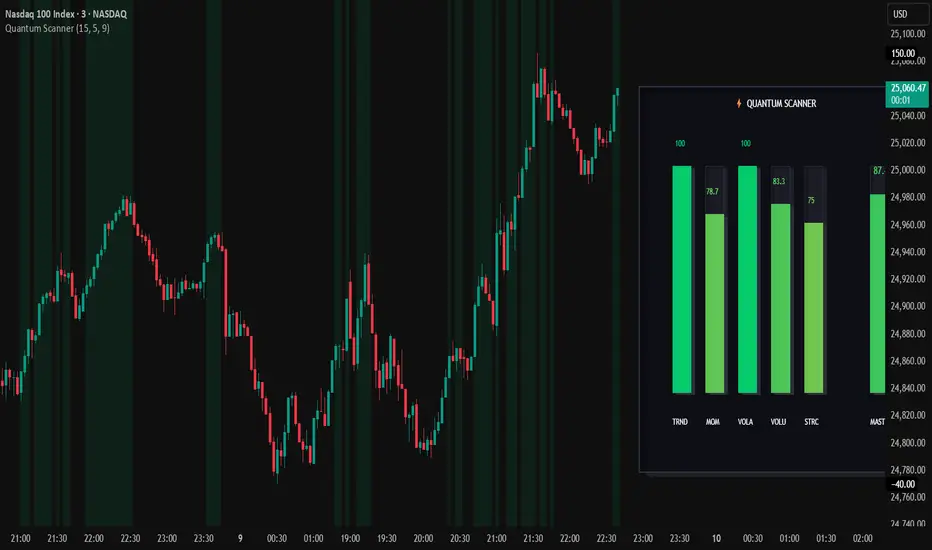
The Quantum State Scanner [Pro Equalizer] is an advanced quantitative dashboard designed to provide a comprehensive "Health Check" of any financial instrument. Instead of relying on a single timeframe or a single mathematical model, the Quantum Scanner aggregates data across 12 distinct lookback periods (based on the Fibonacci sequence) to calculate the market's true state.
By normalizing complex data into a simplified 0-100 Equalizer HUD, traders can instantly identify whether a move is backed by broad-spectrum consensus or is simply a low-conviction anomaly.
The 5 Pillars of Quantum Analysis
The scanner calculates five core "Quantum Pillars" before aggregating them into a final Master Score:
1. Trend (TRND): Analyzes the relationship between Price, VWMA, and EMA across 12 periods. Considers whether price is structurally bullish or bearish.
2. Momentum (MOM): Uses a Stoch-RSI derivation to measure the speed of price movement and identify overbought/oversold exhaustion zones.
3. Volatility (VOLA): Employs a Bollinger/Keltner Squeeze engine. Higher scores indicate expanding volatility (expansion), while lower scores indicate a squeeze (contraction).
4. Volume Delta (VOLU): Measures the internal force of the market by calculating Buy vs. Sell volume pressure.
5. Structure (STRC): A price-action engine that scans for liquidity sweeps (High/Low breaks) and candle rejections to determine structural strength.
How to Read the Scanner
Key Features
1. Dynamic HUD: A sleek, minimalist "Equalizer" UI positioned to the right of your price action.
2. Aggregated Logic: Processes data from lookback periods 5 through 987 simultaneously.
3. Right-Offset Control: Easily move the dashboard to prevent it from overlapping with your candles.
Disclaimer:
Educational Purpose Only: This indicator ("The Script") is provided for educational and informational purposes only. It does not constitute financial, investment, tax, or legal advice.
No Guarantee of Results: Past performance, whether actual or simulated by backtesting, is not indicative of future results. The mathematical models used (including GARCH, Ito’s Lemma, and Volume-Weighted calculations) are theoretical and do not account for market slippage, liquidity gaps, or "black swan" events.
Assumption of Risk: Trading involves a substantial risk of loss and is not suitable for every investor. You are solely responsible for your own trading decisions. Pointalgo and its creators shall not be held liable for any financial losses or damages resulting from the use of this script.
By normalizing complex data into a simplified 0-100 Equalizer HUD, traders can instantly identify whether a move is backed by broad-spectrum consensus or is simply a low-conviction anomaly.
The 5 Pillars of Quantum Analysis
The scanner calculates five core "Quantum Pillars" before aggregating them into a final Master Score:
1. Trend (TRND): Analyzes the relationship between Price, VWMA, and EMA across 12 periods. Considers whether price is structurally bullish or bearish.
2. Momentum (MOM): Uses a Stoch-RSI derivation to measure the speed of price movement and identify overbought/oversold exhaustion zones.
3. Volatility (VOLA): Employs a Bollinger/Keltner Squeeze engine. Higher scores indicate expanding volatility (expansion), while lower scores indicate a squeeze (contraction).
4. Volume Delta (VOLU): Measures the internal force of the market by calculating Buy vs. Sell volume pressure.
5. Structure (STRC): A price-action engine that scans for liquidity sweeps (High/Low breaks) and candle rejections to determine structural strength.
How to Read the Scanner
- 0-40 (Red Zone): Strong Bearish Consensus.
- 40-60 (Yellow Zone): Neutral / Indecision / Consolidation.
- 60-100 (Green Zone): Strong Bullish Consensus.
- High Conviction Signals: When the Master Score exceeds 80 or drops below 20, the background of the chart will dynamically highlight, signaling a potential "Power Move" or trend ignition.
Key Features
1. Dynamic HUD: A sleek, minimalist "Equalizer" UI positioned to the right of your price action.
2. Aggregated Logic: Processes data from lookback periods 5 through 987 simultaneously.
3. Right-Offset Control: Easily move the dashboard to prevent it from overlapping with your candles.
Disclaimer:
Educational Purpose Only: This indicator ("The Script") is provided for educational and informational purposes only. It does not constitute financial, investment, tax, or legal advice.
No Guarantee of Results: Past performance, whether actual or simulated by backtesting, is not indicative of future results. The mathematical models used (including GARCH, Ito’s Lemma, and Volume-Weighted calculations) are theoretical and do not account for market slippage, liquidity gaps, or "black swan" events.
Assumption of Risk: Trading involves a substantial risk of loss and is not suitable for every investor. You are solely responsible for your own trading decisions. Pointalgo and its creators shall not be held liable for any financial losses or damages resulting from the use of this script.
Skrip open-source
Dengan semangat TradingView yang sesungguhnya, pembuat skrip ini telah menjadikannya sebagai sumber terbuka, sehingga para trader dapat meninjau dan memverifikasi fungsinya. Salut untuk penulisnya! Meskipun Anda dapat menggunakannya secara gratis, perlu diingat bahwa penerbitan ulang kode ini tunduk pada Tata Tertib kami.

Unlock powerful tools & indicators → pointalgo.com
Pernyataan Penyangkalan
Informasi dan publikasi ini tidak dimaksudkan, dan bukan merupakan, saran atau rekomendasi keuangan, investasi, trading, atau jenis lainnya yang diberikan atau didukung oleh TradingView. Baca selengkapnya di Ketentuan Penggunaan.
Skrip open-source
Dengan semangat TradingView yang sesungguhnya, pembuat skrip ini telah menjadikannya sebagai sumber terbuka, sehingga para trader dapat meninjau dan memverifikasi fungsinya. Salut untuk penulisnya! Meskipun Anda dapat menggunakannya secara gratis, perlu diingat bahwa penerbitan ulang kode ini tunduk pada Tata Tertib kami.
Unlock powerful tools & indicators → pointalgo.com
Pernyataan Penyangkalan
Informasi dan publikasi ini tidak dimaksudkan, dan bukan merupakan, saran atau rekomendasi keuangan, investasi, trading, atau jenis lainnya yang diberikan atau didukung oleh TradingView. Baca selengkapnya di Ketentuan Penggunaan.