OPEN-SOURCE SCRIPT
Difficulty per Issuance - PoW Pricing Model | Astral Vision
Difficulty per Issuance - PoW Pricing Model | Astral Vision 🌠💠
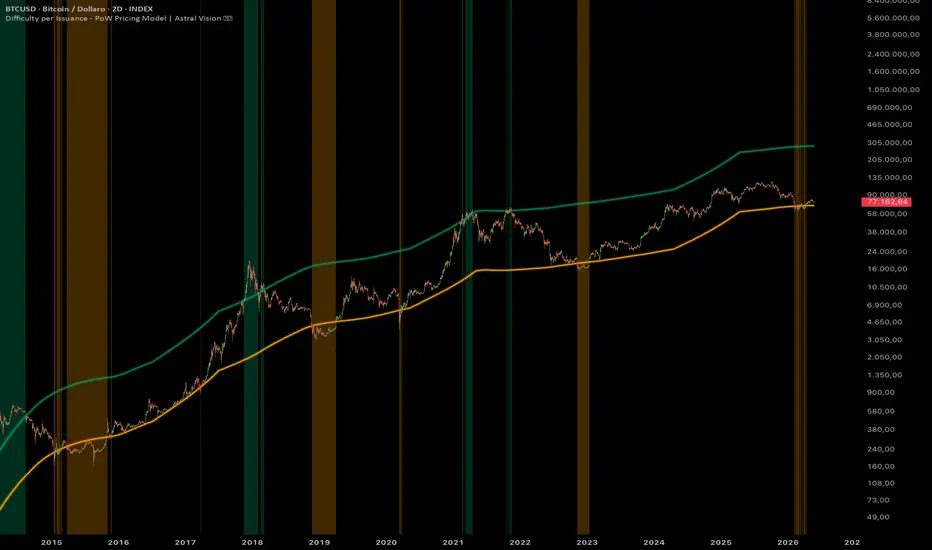
This indicator derives a fundamental price floor for Bitcoin from the relationship between mining difficulty and coin issuance, using the proof-of-work mechanism itself as the pricing oracle. The core premise is that the difficulty of mining a block represents the aggregate computational and economic effort the network expends to produce Bitcoin, while the issuance represents what the network produces in return. The ratio between these two quantities, with a damping correction for the non-linear scaling of difficulty, produces a model price that reflects the cost of production in computational terms rather than in fiat currency.
Calculation ⚙️
The mining difficulty is smoothed with a configurable simple moving average to remove the noise from individual difficulty adjustments, which occur approximately every two weeks and can jump or drop abruptly. The smoothed difficulty is then raised to a configurable power k using the exponential of k times the natural log of difficulty, which is mathematically equivalent to difficulty^k. The exponent k is the damping coefficient: a value of 1.0 would mean difficulty scales linearly with the model price, but empirically the relationship is sub-linear, meaning that doubling difficulty does not double the cost per coin proportionally. Values around 0.4 have historically produced the tightest fit to Bitcoin's long-term price floor.
The issuance is computed as the daily block reward in BTC multiplied by 144 blocks per day, using the halving schedule to determine the correct subsidy at each point in history: 50 BTC per block before the first halving in November 2012, halving at each subsequent 210,000-block interval to 25, 12.5, 6.25, and 3.125 BTC. This daily issuance is summed over a configurable rolling window to smooth the effect of halving step-changes, which would otherwise create discontinuities in the model output. The base model price is then: a × difficulty^k / issuance sum, where a is a configurable scaling factor.
The upper band applies a dynamic multiplier to the base price that decays exponentially over time from a configurable starting year. The formula is: multiplier = floor + (start - floor) × exp(-decay rate × days elapsed). This produces a multiplier that begins at the start value and asymptotically approaches the floor value as Bitcoin ages, reflecting the empirically observed compression of the peak-to-floor ratio across successive market cycles. When the multiplier is high in early history, the upper band sits far above the base price, capturing the explosive cycle amplitude of early Bitcoin. As the multiplier decays toward the floor, the upper band converges toward the base price, consistent with diminishing cycle returns.
Plots 📊
Inputs 🎛️
Colors 🎨
5 Astral Vision presets + custom override. Default: Hermes.
Purpose 🎯
Standard technical price floors such as moving averages or Fibonacci retracements are derived entirely from Bitcoin's own price history and have no connection to the physical cost of the network. This model derives its floor from the computational work required to produce coins, making it independent of price action and grounded in the thermodynamics of proof-of-work. Unlike fiat-denominated mining cost models that require electricity price assumptions, this model uses only on-chain data, making it objective and reproducible. The time-decaying upper band reflects the structural reality that each Bitcoin cycle has historically produced diminishing peak-to-floor ratios, calibrating the top reference to each cycle's expected amplitude rather than applying a fixed multiplier that becomes increasingly unrealistic as the market matures.
Disclaimer ⭕️
This indicator is for informational and educational purposes only. It does not constitute financial advice. Past performance is not indicative of future results. Always do your own research before making investment decisions.
This indicator derives a fundamental price floor for Bitcoin from the relationship between mining difficulty and coin issuance, using the proof-of-work mechanism itself as the pricing oracle. The core premise is that the difficulty of mining a block represents the aggregate computational and economic effort the network expends to produce Bitcoin, while the issuance represents what the network produces in return. The ratio between these two quantities, with a damping correction for the non-linear scaling of difficulty, produces a model price that reflects the cost of production in computational terms rather than in fiat currency.
Calculation ⚙️
The mining difficulty is smoothed with a configurable simple moving average to remove the noise from individual difficulty adjustments, which occur approximately every two weeks and can jump or drop abruptly. The smoothed difficulty is then raised to a configurable power k using the exponential of k times the natural log of difficulty, which is mathematically equivalent to difficulty^k. The exponent k is the damping coefficient: a value of 1.0 would mean difficulty scales linearly with the model price, but empirically the relationship is sub-linear, meaning that doubling difficulty does not double the cost per coin proportionally. Values around 0.4 have historically produced the tightest fit to Bitcoin's long-term price floor.
The issuance is computed as the daily block reward in BTC multiplied by 144 blocks per day, using the halving schedule to determine the correct subsidy at each point in history: 50 BTC per block before the first halving in November 2012, halving at each subsequent 210,000-block interval to 25, 12.5, 6.25, and 3.125 BTC. This daily issuance is summed over a configurable rolling window to smooth the effect of halving step-changes, which would otherwise create discontinuities in the model output. The base model price is then: a × difficulty^k / issuance sum, where a is a configurable scaling factor.
The upper band applies a dynamic multiplier to the base price that decays exponentially over time from a configurable starting year. The formula is: multiplier = floor + (start - floor) × exp(-decay rate × days elapsed). This produces a multiplier that begins at the start value and asymptotically approaches the floor value as Bitcoin ages, reflecting the empirically observed compression of the peak-to-floor ratio across successive market cycles. When the multiplier is high in early history, the upper band sits far above the base price, capturing the explosive cycle amplitude of early Bitcoin. As the multiplier decays toward the floor, the upper band converges toward the base price, consistent with diminishing cycle returns.
Plots 📊
- Base model price line with glow effect: historical cost floor derived from difficulty and issuance
- Upper band line with glow effect: base price multiplied by the time-decaying dynamic multiplier
- Background color on the price chart when price is above the upper band or below the base line
- Candle coloring on the price chart: positive color below base, negative color above upper band, neutral between the two
Inputs 🎛️
- Scaling Factor a: calibrates the absolute level of the model price
- Damping Coefficient k: controls the sub-linear scaling of difficulty in the model
- Difficulty MA Length: smoothing window for the raw difficulty series
- Issuance Sum Window: rolling sum window for the daily issuance, smoothing halving discontinuities
- Upper Band Start Multiplier: initial multiplier applied to the base price for the upper band
- Upper Band Floor Multiplier: asymptotic lower bound of the decaying multiplier
- Decay Rate: speed of exponential decay of the upper band multiplier over time
- Decay Start Year: reference year from which the decay timer begins
Colors 🎨
5 Astral Vision presets + custom override. Default: Hermes.
Purpose 🎯
Standard technical price floors such as moving averages or Fibonacci retracements are derived entirely from Bitcoin's own price history and have no connection to the physical cost of the network. This model derives its floor from the computational work required to produce coins, making it independent of price action and grounded in the thermodynamics of proof-of-work. Unlike fiat-denominated mining cost models that require electricity price assumptions, this model uses only on-chain data, making it objective and reproducible. The time-decaying upper band reflects the structural reality that each Bitcoin cycle has historically produced diminishing peak-to-floor ratios, calibrating the top reference to each cycle's expected amplitude rather than applying a fixed multiplier that becomes increasingly unrealistic as the market matures.
Disclaimer ⭕️
This indicator is for informational and educational purposes only. It does not constitute financial advice. Past performance is not indicative of future results. Always do your own research before making investment decisions.
Skrip open-source
Dengan semangat TradingView yang sesungguhnya, pembuat skrip ini telah menjadikannya sebagai sumber terbuka, sehingga para trader dapat meninjau dan memverifikasi fungsinya. Salut untuk penulisnya! Meskipun Anda dapat menggunakannya secara gratis, perlu diingat bahwa penerbitan ulang kode ini tunduk pada Tata Tertib kami.

My premium indicators are available on Whop:
whop.com/astralvision
Astral Vision 🌠💠
whop.com/astralvision
Astral Vision 🌠💠
Pernyataan Penyangkalan
Informasi dan publikasi ini tidak dimaksudkan, dan bukan merupakan, saran atau rekomendasi keuangan, investasi, trading, atau jenis lainnya yang diberikan atau didukung oleh TradingView. Baca selengkapnya di Ketentuan Penggunaan.
Skrip open-source
Dengan semangat TradingView yang sesungguhnya, pembuat skrip ini telah menjadikannya sebagai sumber terbuka, sehingga para trader dapat meninjau dan memverifikasi fungsinya. Salut untuk penulisnya! Meskipun Anda dapat menggunakannya secara gratis, perlu diingat bahwa penerbitan ulang kode ini tunduk pada Tata Tertib kami.
My premium indicators are available on Whop:
whop.com/astralvision
Astral Vision 🌠💠
whop.com/astralvision
Astral Vision 🌠💠
Pernyataan Penyangkalan
Informasi dan publikasi ini tidak dimaksudkan, dan bukan merupakan, saran atau rekomendasi keuangan, investasi, trading, atau jenis lainnya yang diberikan atau didukung oleh TradingView. Baca selengkapnya di Ketentuan Penggunaan.