Diupdate
Desgarron - NFP Day Model for NQ, ES + RTY
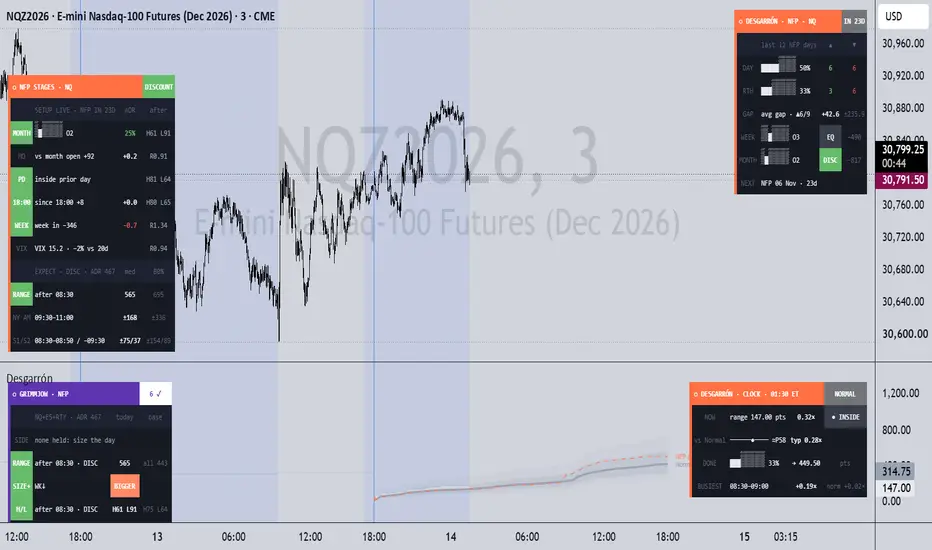
• the structure the release trades into;
• how far NFP days with today's setup usually move, at today's ADR20;
• each release stage live against the dollar;
• Grimmjow, a table of what held for today's setup;
• today's range against the typical NFP day.
The figures are pooled across NQ, ES and RTY: 99 releases and 293 symbol-days. A ✓ row held in 2018–24, again in 2025–26, and on each of the three markets. It is a map of how NFP days usually behave, not a signal generator.
WHAT IT DRAWS ON PRICE
• Pre-release range (07:00–08:29): drawn live from 07:00. It stops at the bar where the release breaks one of its sides.
• Dealing range (07:00–09:00): created when the release breaks the pre-release range, or at 09:00 if it never does. It is drawn from 07:00, follows the high and low until 09:00, then stays fixed, with an optional 50% line and fill.
• Release window: 08:30 to 09:00 is shaded (the end is adjustable). A flag above the release push is tied by a stem to the 08:30 open.
• Stage lines: the 08:50 line, plus the 08:30 and 08:50 opens carried right of price.
• Week open and RTH gap: the week's open carried right, and from 09:30 the prior 16:14 close and the gap's 50%.
• ATH: the all-time high, drawn from the day it was set and carried right of price.
• ATH CE: at 08:30, the consequent encroachment (50%) between the ATH and the 08:29 close forms. It runs to 17:00 or into the next session to 11:00 (the Monday after a Friday release). Its label gives how often NFP days touched it from that distance.
How often NFP days touched the CE, by its distance from price at 08:29 (by 17:00 / by the next session's 11:00):
• within 0.5 ADR: 79% / 83%;
• 0.5–1 ADR: 23% / 31%;
• 1–2 ADR: 1% / 6%;
• beyond 2 ADR: 0% / 0%.
STAGES CARD
Stage 1 is 08:30 → 08:50 (the release push). Stage 2 is 08:50 → 09:30 (into the RTH open). The header pill shows where price sits in the month's range: discount (bottom quarter), middle or premium (top quarter). It shows this first because it is the setup that sized NFP days most.
SETUP runs live, then is fixed at 08:29 on NFP day. Each row shows the odds for its group:
• the month's octant;
• the distance from the month's open;
• the prior day's high and low;
• the move since 18:00;
• the week into the release;
• VIX against its 20-day average.
EXPECT (before 08:30) gives the median and 80th percentile at today's ADR20 for:
• the range after 08:30;
• NY AM;
• stage 1 and stage 2.
LIVE (after 08:30) shows:
• each stage in points, against its expected size and against DXY's move in the same window;
• the range since 08:30 against the expected median.
GRIMMJOW (INDICATOR PANE)
Grimmjow lists what held on NFP days for today's setup, in points at today's ADR20.
• Range after 08:30 for today's month position: 1.21 ADR from a discount vs 0.88 from a premium ✓. A second row lists the other size groups active today and whether they point bigger or smaller:
– VIX more than 10% over its average: 1.35 ✓; more than 10% under: 0.69 ✓;
– week up more than 0.5 ADR into the release: 0.82 ✓; week down: 1.34 ✓;
– more than 1 ADR over the month's open: 0.90 ✓; under: 1.37 ✓.
• New high / low after 08:30 for the most specific group active today:
– from a monthly discount, a new low came on 91% of days ✓;
– from below the prior day's low: new high 36% ✓, new low 92% ✓;
– after a drop of more than 0.4 ADR since 18:00: new high 19% ✓, new low 85% ✓.
• ATH CE: its distance, its odds and when it was hit. Within 0.5 ADR is held ✓.
• First side of the pre-release range taken after 08:30: it went on to be the bigger side of the day 59% of the time. With VIX more than 10% under its average: 79% ✓. After an up week: 74% ✓. After a flat week: 46% ✓. The row also shows which side broke and when.
• DXY: once DXY's move is big, the index went the other way:
– stage 1 (DXY moved ≥ 0.42 of its ADR20): 82% vs 53% ✓;
– stage 2 (≥ 0.22): 71% vs 59% ✓.
• 08:30–09:00: the day's range grows +0.14 ADR at the median, against nothing on ordinary days ✓.
• Side: a HYDRA search over everything knowable at 08:29 found no feature that called the direction out of sample. That is why both the card and Grimmjow size the day rather than pick a side.
EVENT CLOCK AND TALLY
• Event clock (pane): today's running range from 18:00 (or its net move), against NFP days or normal days at the same time of day. It shows the median path with 25–75% and 10–90% bands, in half-hour steps at today's ADR20. A NOW status reads Above, Inside or Below the middle half.
• Tally card:
– the last N NFP days' up and down closes and their average RTH gap;
– where price sits in this week's and this month's range, by octant;
– the next release.
The octant is a locator, not a tested signal.
SETTINGS
View sits at the top, the same as in my other indicators:
• Pane: clock + Grimmjow, the clock, Grimmjow, or cards only;
• Clock measure: range or net move;
• Theme: Auto follows the chart;
• Layout: Desktop or Mobile;
• Card text: tiny, small or normal.
Model structure has on/off, colour, style and width for each range, plus the 50% line and fill, how far the ranges run, the release window's end, label size, the ATH style and the CE's end.
Mobile folds the cards for a phone: a five-row stages card and a six-row Grimmjow. The full wording stays in the tooltips.
HOW TO USE
• Built for NQ / MNQ, ES / MES and RTY / M2K, continuous or front month. On other symbols the clock and tally show NQ's figures.
• 1 to 15-minute charts suit the structure. The stages need 30 minutes or less, and the clock 60 minutes or less.
• Make the indicator pane tall enough for Grimmjow.
• For a phone, use a separate chart layout with Layout = Mobile, since chart layouts sync across devices.
DATA AND METHOD
• NQ, ES and RTY front-month 1-minute data, Jan 2018 – Oct 2026: 99 NFP releases, 293 symbol-days.
• A row gets a ✓ only if all of these held:
– p < 0.05 with errors clustered by release date;
– the same side in 2018–24 and in 2025–26;
– the same side on each of NQ, ES and RTY.
• Several thousand group tests were run across the calendar models, so treat the ✓ rows as the steadiest descriptions, not proven edges. The rows with the most days behind them (range by month position, VIX and the week into the release, the big-DXY rows) are the most dependable.
• DXY rows: DXY futures, Feb 2023 – Jul 2026 (60 big-move stage-1 readings on 20 releases). On the chart they read TVC:DXY, which can be changed in the inputs.
• ADR20 = mean (high − low) of the last 20 complete trading days.
• Release dates come from the BLS schedule and are loaded to Dec 2027. Add new years in S_NFP and raise LAST_DATE.
• No higher-timeframe value leaks future data.
These are historical frequencies on 99 releases: useful context, not guarantees. Same-window DXY rows describe how a stage finishes and cannot be known in advance. In Bar Replay, TradingView may not feed TVC:DXY minute by minute, so the DXY pills can read near zero there. The 2025 lapse moved two releases (20 Nov and 16 Dec 2025); both are in the dates. Nothing here is financial advice.
CREDITS
ICT concepts (Michael J. Huddleston): the dealing range, consequent encroachment, premium and discount, the RTH gap and its 50%. Event clock after Kyōka Suigetsu. Part of the Hueco Mundo set; Grimmjow's claws are Model 6's disruption idea. Written from scratch; open source under MPL 2.0.
Catatan Rilis
– the long tooltips are stored once instead of copied into every use, so the script sits well under Pine's size limit (it was close enough that any addition would have stopped it loading);– the first dealing-range side now registers;
– the tally's week row no longer reads "−-58" in Bar Replay;
– the clock card's title.
Catatan Rilis
Fixes:– the long tooltips are stored once instead of copied into every use, so the script sits well under Pine's size limit (it was close enough that any addition would have stopped it loading);
– the first dealing-range side now registers;
– the tally's week row no longer reads "−-58" in Bar Replay;
– the clock card's title.

Pernyataan Penyangkalan
Informasi dan publikasi ini tidak dimaksudkan, dan bukan merupakan, saran atau rekomendasi keuangan, investasi, trading, atau jenis lainnya yang diberikan atau didukung oleh TradingView. Baca selengkapnya di Ketentuan Penggunaan.
Pernyataan Penyangkalan
Informasi dan publikasi ini tidak dimaksudkan, dan bukan merupakan, saran atau rekomendasi keuangan, investasi, trading, atau jenis lainnya yang diberikan atau didukung oleh TradingView. Baca selengkapnya di Ketentuan Penggunaan.