Trend Lines & Channels Pro [AlgoChief]
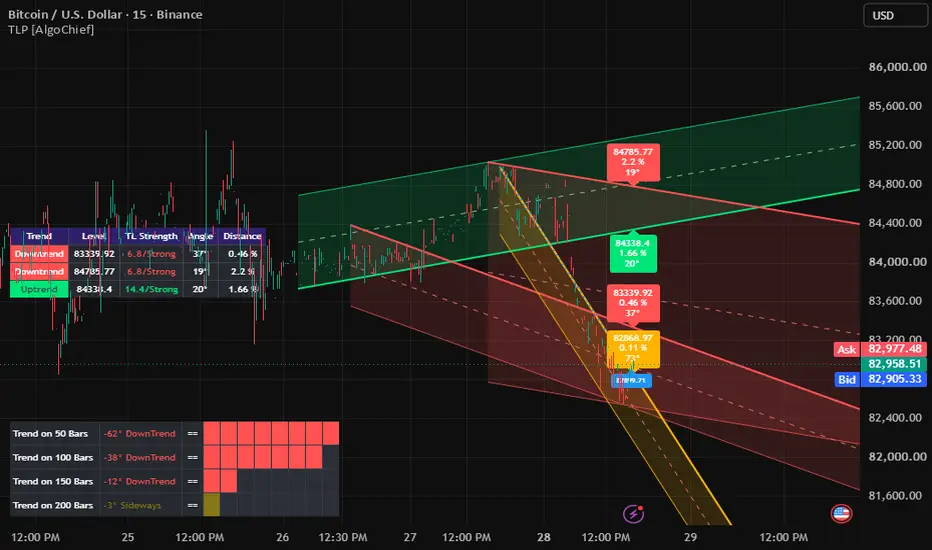
# Trend Lines & Channels Pro [AlgoChief]
### An Institutional-Grade Trendline, Support/Resistance Channel, and Multi-Period Market Structure Suite Engineered for Modern Price Action Traders
---
### 📌 Overview & Core Philosophy
Drawing trendlines is traditionally one of the most subjective tasks in technical analysis. Ten different traders often draw ten different lines on the exact same chart. When lines are drawn arbitrarily across arbitrary candle wicks, they lead to false breakouts, whipsaws, and execution hesitation.
**Trend Lines & Channels Pro [AlgoChief]** eliminates human subjectivity by applying rigorous geometric and mathematical validation to identify true institutional support and resistance boundaries.
Instead of relying on single razor-thin lines, this indicator models trendlines as **dynamic structural channels** by evaluating:
1. **Pivot Confirmation**: Identifying true structural pivot points over user-defined lookback periods.
2. **Channel Geometry & Touch Validation**: Scoring each line based on how many pivot points fit within a defined threshold channel band.
3. **Angular Inclination & Velocity**: Calculating true degrees of slope ($0^\circ$ to $90^\circ$) to filter out noisy or horizontal drift while highlighting high-velocity trends.
4. **Market Structure Alignment**: Running real-time linear regression across multiple time frames/lengths to confirm overall directional momentum.
---
### ✨ Key Features Breakdown
#### 1. Multi-Pivot Channel Solver & Strength Scoring
* **Algorithmic Fitting**: The indicator identifies confirmed swing highs and swing lows and solves for lines that encompass the highest concentration of pivot points.
* **Auto-Scored Strength**: Each discovered trendline is scored based on pivot touches and validation density. Lines exceeding the **Minimum Strength** threshold are classified as **Strong** (solid lines), while secondary candidate levels are rendered as **Weak** (subtle dotted lines).
#### 2. Shaded Channels with Equilibrium Midlines (`linefill`)
* Price action rarely reverses at an exact pixel on a screen. By enabling **Trend Channels**, the indicator projects upper, lower, and equilibrium (midline) boundaries.
* Semi-transparent color fills allow you to see at a glance whether price is testing channel equilibrium, bouncing from lower demand, or exhausting into upper supply.
#### 3. True Angular Analysis & Steep Slope Alerts
* **Angle Calculation**: Measures the real geometric inclination of every trendline in degrees ($0^\circ - 90^\circ$).
* **Angle Separation Filter**: Prevents chart clutter by discarding parallel lines that share near-identical slopes.
* **Steep Momentum Highlighting**: Automatically changes trendline color (e.g., to amber/yellow) when a trendline exceeds a user-defined steepness angle (e.g., $> 45^\circ$), warning you of potential overextended climax moves.
#### 4. Broken Trendline Memory & Re-Test Engine
* When an active trendline breaks, the indicator does not simply delete it. It retains the **Last Broken Trendline** on the chart as a dotted reference line for a configurable number of bars.
* Tracks breakout levels and alerts you when price pulls back to perform a **classical Break & Retest** confirmation.
#### 5. Angle Bisector (Compression & Squeeze Projector)
* When an active uptrend line and downtrend line converge, the indicator can dynamically project the **Angle Bisector**.
* This bisector line acts as the central median vector of converging wedges, pennants, and triangles, helping you identify future apex breakout targets.
#### 6. Multi-Period Market Structure HUD Table
* Displays a compact on-chart dashboard evaluating trend direction and slope across **4 distinct historical lengths** (e.g., 50, 100, 150, 200 bars).
* Visual color-coded power bars show real-time momentum strength and warning signs when macro and micro trends conflict.
#### 7. Active Trendlines HUD Matrix
* A clean heads-up table that lists current active support and resistance levels, their strength ratings, angular inclinations, and exact percentage distance from the current market close.
#### 8. External Signal Plot for Automated Trading Bots
* Includes a machine-readable numeric output (`ext_signal`) designed for webhook automations (PineConnector, 3Commas, WunderTrading, Alertatron):
* `1.0` = Support Broken (Bearish Breakout)
* `2.0` = Resistance Broken (Bullish Breakout)
* `3.0` = Inside Support Channel
* `4.0` = Inside Resistance Channel
* `5.0` = Bounce Up from Support (Bullish Rejection)
* `6.0` = Bounce Down from Resistance (Bearish Rejection)
* `7.0` = Strong Steep Uptrend Detected
* `8.0` = Strong Steep Downtrend Detected
* `9.0` = Support Re-Broken
* `10.0` = Resistance Re-Broken
* `11.0` = Brand New Uptrend Line Established
* `12.0` = Brand New Downtrend Line Established
* `Fractional decimals` = Normalized percentage distance to nearest S/R
#### 9. All-in-One Alert Engine with Dynamic Placeholders
* Single consolidated alert mechanism supporting comprehensive string templates. You can customize webhook JSON payloads using real-time placeholders:
* `{{ticker}}`, `{{timeframe}}`, `{{close}}`, `{{time}}`
* `{{CurrentSupport}}`, `{{CurrentResistance}}`
* `{{CurrentSupportAngle}}`, `{{CurrentResistanceAngle}}`
* `{{BrokenSupport}}`, `{{BrokenResistance}}`
* `{{ReBrokenSupport}}`, `{{ReBrokenResistance}}`
* `{{TriangleDistancePercent}}`, `{{DistanceTosrPercent}}`
---
### 📖 How to Trade with Trend Lines & Channels Pro
#### Strategy 1: The Channel Bounce (Trend Continuation)
* **Setup**: Wait for price to enter a **Strong Uptrend Channel**.
* **Confirmation**: Look for candle wick rejection from the channel lower band, accompanied by the **Bounce Back Up from Support** signal.
* **Execution**: Enter Long with stop loss below the channel lower boundary; target channel midline and upper band.
#### Strategy 2: Breakout & Broken Line Retest
* **Setup**: Price decisively closes outside a major downtrend channel with strong volume.
* **Confirmation**: The script highlights the breakout level and keeps the broken line active. Wait for a re-test of the broken line (which now acts as new support).
* **Execution**: Enter on the re-test confirmation for higher risk-to-reward continuation entries.
#### Strategy 3: Squeeze Compression & S/R Breakout
* **Setup**: Distance between upper and lower trendlines compresses below the **Triangle Squeeze** threshold ($< 2\%$).
* **Execution**: Prepare for an explosive expansion breakout. Trigger alerts on either Support or Resistance breaks to capture the initial surge.
---
### ⚙️ Input Settings Guide
| Parameter | Type | Default | Description |
| :--- | :--- | :--- | :--- |
| **Pivot Period** | Integer | `4` | Left/Right bar confirmation count for swing high/low pivots. |
| **Source for Pivots** | String | `High/Low` | Use candle wicks (`High/Low`) or candle bodies (`Close`) for pivot calculations. |
| **Threshold Rate** | Float | `4.0` | Determines channel width band around the primary trendline. |
| **Minimum Strength** | Float | `3.0` | Minimum score required for a trendline to be categorized as Strong. |
| **Maximum Loopback** | Integer | `350` | Maximum lookback window for historical pivot detection. |
| **Show Trendlines as** | String | `Trend Channel With Midline` | Display style: single line, standard channel, or channel with 50% midline. |
| **Shaded Channels** | Boolean | `True` | Fills the channel zone with translucent background color. |
| **Minimum Angle Rate** | Float | `15.0°` | Minimum angular difference required before establishing a concurrent trendline. |
| **Angle Threshold** | Float | `45.0°` | Slope threshold above which lines are highlighted with steep momentum color. |
| **Show Last Broken Line** | Boolean | `True` | Keeps the most recently invalidated trendline visible for retest analysis. |
| **Show Angle Bisector** | Boolean | `False` | Computes and projects the median bisector of converging trendlines. |
| **Market Structure Table**| Boolean | `True` | Renders the 4-length linear regression trend and momentum matrix. |
| **Trend Lines Table** | Boolean | `True` | Renders the active S/R levels, strength scores, and distances. |
---
### ⚠️ Risk Disclaimer
This indicator is developed for educational, analytical, and research purposes only. Technical analysis indicators, including automated trendlines and channels, cannot guarantee future price movements. Always apply strict risk management, appropriate position sizing, and combine structural indicators with broader market context before executing real-capital trades.
---
### An Institutional-Grade Trendline, Support/Resistance Channel, and Multi-Period Market Structure Suite Engineered for Modern Price Action Traders
---
### 📌 Overview & Core Philosophy
Drawing trendlines is traditionally one of the most subjective tasks in technical analysis. Ten different traders often draw ten different lines on the exact same chart. When lines are drawn arbitrarily across arbitrary candle wicks, they lead to false breakouts, whipsaws, and execution hesitation.
**Trend Lines & Channels Pro [AlgoChief]** eliminates human subjectivity by applying rigorous geometric and mathematical validation to identify true institutional support and resistance boundaries.
Instead of relying on single razor-thin lines, this indicator models trendlines as **dynamic structural channels** by evaluating:
1. **Pivot Confirmation**: Identifying true structural pivot points over user-defined lookback periods.
2. **Channel Geometry & Touch Validation**: Scoring each line based on how many pivot points fit within a defined threshold channel band.
3. **Angular Inclination & Velocity**: Calculating true degrees of slope ($0^\circ$ to $90^\circ$) to filter out noisy or horizontal drift while highlighting high-velocity trends.
4. **Market Structure Alignment**: Running real-time linear regression across multiple time frames/lengths to confirm overall directional momentum.
---
### ✨ Key Features Breakdown
#### 1. Multi-Pivot Channel Solver & Strength Scoring
* **Algorithmic Fitting**: The indicator identifies confirmed swing highs and swing lows and solves for lines that encompass the highest concentration of pivot points.
* **Auto-Scored Strength**: Each discovered trendline is scored based on pivot touches and validation density. Lines exceeding the **Minimum Strength** threshold are classified as **Strong** (solid lines), while secondary candidate levels are rendered as **Weak** (subtle dotted lines).
#### 2. Shaded Channels with Equilibrium Midlines (`linefill`)
* Price action rarely reverses at an exact pixel on a screen. By enabling **Trend Channels**, the indicator projects upper, lower, and equilibrium (midline) boundaries.
* Semi-transparent color fills allow you to see at a glance whether price is testing channel equilibrium, bouncing from lower demand, or exhausting into upper supply.
#### 3. True Angular Analysis & Steep Slope Alerts
* **Angle Calculation**: Measures the real geometric inclination of every trendline in degrees ($0^\circ - 90^\circ$).
* **Angle Separation Filter**: Prevents chart clutter by discarding parallel lines that share near-identical slopes.
* **Steep Momentum Highlighting**: Automatically changes trendline color (e.g., to amber/yellow) when a trendline exceeds a user-defined steepness angle (e.g., $> 45^\circ$), warning you of potential overextended climax moves.
#### 4. Broken Trendline Memory & Re-Test Engine
* When an active trendline breaks, the indicator does not simply delete it. It retains the **Last Broken Trendline** on the chart as a dotted reference line for a configurable number of bars.
* Tracks breakout levels and alerts you when price pulls back to perform a **classical Break & Retest** confirmation.
#### 5. Angle Bisector (Compression & Squeeze Projector)
* When an active uptrend line and downtrend line converge, the indicator can dynamically project the **Angle Bisector**.
* This bisector line acts as the central median vector of converging wedges, pennants, and triangles, helping you identify future apex breakout targets.
#### 6. Multi-Period Market Structure HUD Table
* Displays a compact on-chart dashboard evaluating trend direction and slope across **4 distinct historical lengths** (e.g., 50, 100, 150, 200 bars).
* Visual color-coded power bars show real-time momentum strength and warning signs when macro and micro trends conflict.
#### 7. Active Trendlines HUD Matrix
* A clean heads-up table that lists current active support and resistance levels, their strength ratings, angular inclinations, and exact percentage distance from the current market close.
#### 8. External Signal Plot for Automated Trading Bots
* Includes a machine-readable numeric output (`ext_signal`) designed for webhook automations (PineConnector, 3Commas, WunderTrading, Alertatron):
* `1.0` = Support Broken (Bearish Breakout)
* `2.0` = Resistance Broken (Bullish Breakout)
* `3.0` = Inside Support Channel
* `4.0` = Inside Resistance Channel
* `5.0` = Bounce Up from Support (Bullish Rejection)
* `6.0` = Bounce Down from Resistance (Bearish Rejection)
* `7.0` = Strong Steep Uptrend Detected
* `8.0` = Strong Steep Downtrend Detected
* `9.0` = Support Re-Broken
* `10.0` = Resistance Re-Broken
* `11.0` = Brand New Uptrend Line Established
* `12.0` = Brand New Downtrend Line Established
* `Fractional decimals` = Normalized percentage distance to nearest S/R
#### 9. All-in-One Alert Engine with Dynamic Placeholders
* Single consolidated alert mechanism supporting comprehensive string templates. You can customize webhook JSON payloads using real-time placeholders:
* `{{ticker}}`, `{{timeframe}}`, `{{close}}`, `{{time}}`
* `{{CurrentSupport}}`, `{{CurrentResistance}}`
* `{{CurrentSupportAngle}}`, `{{CurrentResistanceAngle}}`
* `{{BrokenSupport}}`, `{{BrokenResistance}}`
* `{{ReBrokenSupport}}`, `{{ReBrokenResistance}}`
* `{{TriangleDistancePercent}}`, `{{DistanceTosrPercent}}`
---
### 📖 How to Trade with Trend Lines & Channels Pro
#### Strategy 1: The Channel Bounce (Trend Continuation)
* **Setup**: Wait for price to enter a **Strong Uptrend Channel**.
* **Confirmation**: Look for candle wick rejection from the channel lower band, accompanied by the **Bounce Back Up from Support** signal.
* **Execution**: Enter Long with stop loss below the channel lower boundary; target channel midline and upper band.
#### Strategy 2: Breakout & Broken Line Retest
* **Setup**: Price decisively closes outside a major downtrend channel with strong volume.
* **Confirmation**: The script highlights the breakout level and keeps the broken line active. Wait for a re-test of the broken line (which now acts as new support).
* **Execution**: Enter on the re-test confirmation for higher risk-to-reward continuation entries.
#### Strategy 3: Squeeze Compression & S/R Breakout
* **Setup**: Distance between upper and lower trendlines compresses below the **Triangle Squeeze** threshold ($< 2\%$).
* **Execution**: Prepare for an explosive expansion breakout. Trigger alerts on either Support or Resistance breaks to capture the initial surge.
---
### ⚙️ Input Settings Guide
| Parameter | Type | Default | Description |
| :--- | :--- | :--- | :--- |
| **Pivot Period** | Integer | `4` | Left/Right bar confirmation count for swing high/low pivots. |
| **Source for Pivots** | String | `High/Low` | Use candle wicks (`High/Low`) or candle bodies (`Close`) for pivot calculations. |
| **Threshold Rate** | Float | `4.0` | Determines channel width band around the primary trendline. |
| **Minimum Strength** | Float | `3.0` | Minimum score required for a trendline to be categorized as Strong. |
| **Maximum Loopback** | Integer | `350` | Maximum lookback window for historical pivot detection. |
| **Show Trendlines as** | String | `Trend Channel With Midline` | Display style: single line, standard channel, or channel with 50% midline. |
| **Shaded Channels** | Boolean | `True` | Fills the channel zone with translucent background color. |
| **Minimum Angle Rate** | Float | `15.0°` | Minimum angular difference required before establishing a concurrent trendline. |
| **Angle Threshold** | Float | `45.0°` | Slope threshold above which lines are highlighted with steep momentum color. |
| **Show Last Broken Line** | Boolean | `True` | Keeps the most recently invalidated trendline visible for retest analysis. |
| **Show Angle Bisector** | Boolean | `False` | Computes and projects the median bisector of converging trendlines. |
| **Market Structure Table**| Boolean | `True` | Renders the 4-length linear regression trend and momentum matrix. |
| **Trend Lines Table** | Boolean | `True` | Renders the active S/R levels, strength scores, and distances. |
---
### ⚠️ Risk Disclaimer
This indicator is developed for educational, analytical, and research purposes only. Technical analysis indicators, including automated trendlines and channels, cannot guarantee future price movements. Always apply strict risk management, appropriate position sizing, and combine structural indicators with broader market context before executing real-capital trades.
---

For access & queries: algochiefsupport@gmail.com
Pernyataan Penyangkalan
Informasi dan publikasi ini tidak dimaksudkan, dan bukan merupakan, saran atau rekomendasi keuangan, investasi, trading, atau jenis lainnya yang diberikan atau didukung oleh TradingView. Baca selengkapnya di Ketentuan Penggunaan.
For access & queries: algochiefsupport@gmail.com
Pernyataan Penyangkalan
Informasi dan publikasi ini tidak dimaksudkan, dan bukan merupakan, saran atau rekomendasi keuangan, investasi, trading, atau jenis lainnya yang diberikan atau didukung oleh TradingView. Baca selengkapnya di Ketentuan Penggunaan.