Diupdate
Risk-Off Ladder [Simple]
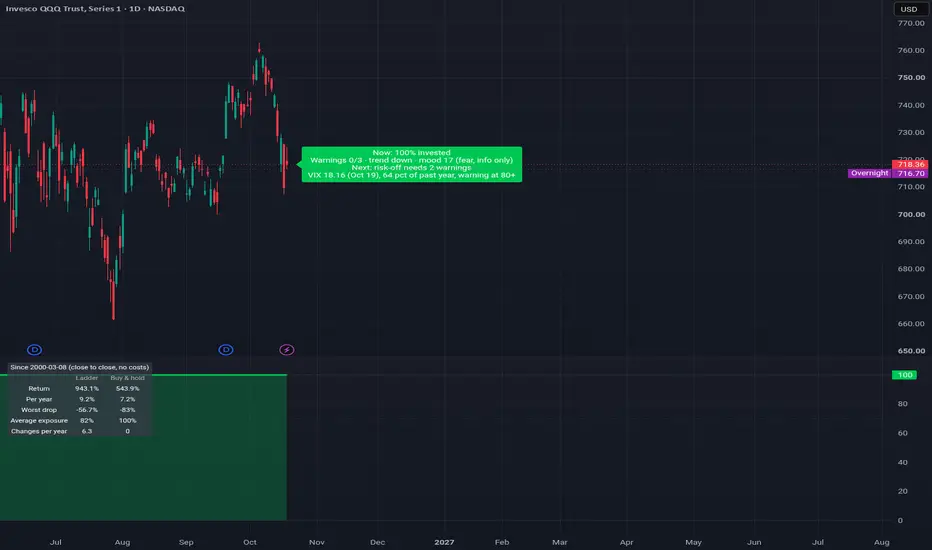
Risk-Off Ladder answers one question: how much should I hold right now? Most of the time the answer is 100%. It steps aside only when the market shows real trouble, and it comes back quickly once a rebound starts.
Every change is a big label on the price chart that shows the action and the result:
BUY → 100%, BUY → 70%, SELL 30% → 70%, SELL ALL → 0%
The risk check (3 warnings):
1. The VIX is in the top 20% of its past year.
2. Price closes below its 200-day average.
3. Price is more than 15% below its one-year high.
The rules (fixed round numbers, no strategy inputs to tweak):
- 0 or 1 warnings: 100%.
- 2 warnings (risk-off): 0%. But if SuperTrend (10, 3) turns up while still in risk-off, it buys back to 70% (a rebound). If SuperTrend turns down again, it goes back to 0%.
- 3 warnings: 0%.
- Moves to 0% and buys from 0% happen at once. Any other change waits at least 10 bars, which keeps changes to about 4–6 a year in normal markets.
How it differs from Trend Safety Switch: Trend Safety Switch sells on every SuperTrend flip down. This ladder ignores SuperTrend while the market is healthy and stays fully invested. It uses SuperTrend only inside risk-off, as the signal to start buying back.
What you see:
- Labels on price. Green BUY, orange partial SELL, red SELL ALL. The small second line gives the reason.
- Exposure pane. A step line colored green (100%), lime (70%) or red (0%).
- Red background on price while risk-off is on.
- "Now" readout. Exposure, warnings out of 3, trend, and what would change it next. It also shows a fear / greed mood reading from the Market Fear Meter gauge; this is for context only and does not change the rules.
- Results table. The ladder vs buy-and-hold since a start date you pick: return, per year, worst drop, average exposure and changes per year. It compounds close to close with no costs, so treat it as a rough guide.
No repainting: everything is decided at the bar close. The VIX is read on the chart's timeframe with no lookahead.
Alerts:
- "BUY (exposure up)", "SELL part", "SELL ALL (risk-off)" and "Any exposure change".
- Or one "Any alert() function call" alert. Its message includes the new exposure and the reason.
Honest backtest (daily, signal at the close and fill at the next open, 0.02% commission plus $0.02 slippage per order):
- QQQ since 2000:
- Ladder +1,166% (9.9% a year), worst drop −46%, about 81% invested, about 6 changes a year.
- Buy-and-hold +817% (8.6% a year), worst drop −83%.
- QQQ since 2010:
- Ladder 14.5% a year, worst drop −23%.
- Buy-and-hold 18.7% a year, worst drop −35%.
- SPY since 2000:
- Ladder 7.3% a year, worst drop −35%.
- Buy-and-hold 8.3% a year, worst drop −55%.
- SPY since 2010:
- Ladder 10.9% a year, worst drop −27%.
- Buy-and-hold 14.0% a year, worst drop −34%.
- 2025 to Oct 2026:
- QQQ: ladder +28% vs buy-and-hold +39%.
- SPY: ladder +23% vs +32%.
- In strong bull years it lags buy-and-hold. Since 2010 the gap is about 3–4% a year. The benefit is a smaller worst drop and earlier re-entry after crashes.
- Choppy bear markets whipsaw it. In 2022 SPY lost about as much as buy-and-hold. In 2020 SPY it ended slightly negative while buy-and-hold made +18%.
Tips:
- It was built and tested on daily charts of broad US index ETFs.
- For other markets, turn off the VIX warning.
- Use it as a guide for how heavy to be, together with your own plan.
Credits:
- SuperTrend: Olivier Seban. The band and flip code is based on KivancOzbilgic's open-source SuperTrend, which credits everget.
- Williams VIX Fix (mood reading only): Larry Williams. The spike code is based on ChrisMoody's CM_Williams_Vix_Fix.
- The risk check and ladder are my own. They build on my earlier free scripts, Trend Safety Switch and Market Fear Meter.
Disclaimer:
- This is for education only and is not financial advice.
- Backtests are hypothetical, and past results do not predict future results.
- Trading involves risk of loss.
Next: I'll post this ladder's live signals on QQQ and SPY here as they happen, good and bad, so you can judge it in real time.
Every change is a big label on the price chart that shows the action and the result:
BUY → 100%, BUY → 70%, SELL 30% → 70%, SELL ALL → 0%
The risk check (3 warnings):
1. The VIX is in the top 20% of its past year.
2. Price closes below its 200-day average.
3. Price is more than 15% below its one-year high.
The rules (fixed round numbers, no strategy inputs to tweak):
- 0 or 1 warnings: 100%.
- 2 warnings (risk-off): 0%. But if SuperTrend (10, 3) turns up while still in risk-off, it buys back to 70% (a rebound). If SuperTrend turns down again, it goes back to 0%.
- 3 warnings: 0%.
- Moves to 0% and buys from 0% happen at once. Any other change waits at least 10 bars, which keeps changes to about 4–6 a year in normal markets.
How it differs from Trend Safety Switch: Trend Safety Switch sells on every SuperTrend flip down. This ladder ignores SuperTrend while the market is healthy and stays fully invested. It uses SuperTrend only inside risk-off, as the signal to start buying back.
What you see:
- Labels on price. Green BUY, orange partial SELL, red SELL ALL. The small second line gives the reason.
- Exposure pane. A step line colored green (100%), lime (70%) or red (0%).
- Red background on price while risk-off is on.
- "Now" readout. Exposure, warnings out of 3, trend, and what would change it next. It also shows a fear / greed mood reading from the Market Fear Meter gauge; this is for context only and does not change the rules.
- Results table. The ladder vs buy-and-hold since a start date you pick: return, per year, worst drop, average exposure and changes per year. It compounds close to close with no costs, so treat it as a rough guide.
No repainting: everything is decided at the bar close. The VIX is read on the chart's timeframe with no lookahead.
Alerts:
- "BUY (exposure up)", "SELL part", "SELL ALL (risk-off)" and "Any exposure change".
- Or one "Any alert() function call" alert. Its message includes the new exposure and the reason.
Honest backtest (daily, signal at the close and fill at the next open, 0.02% commission plus $0.02 slippage per order):
- QQQ since 2000:
- Ladder +1,166% (9.9% a year), worst drop −46%, about 81% invested, about 6 changes a year.
- Buy-and-hold +817% (8.6% a year), worst drop −83%.
- QQQ since 2010:
- Ladder 14.5% a year, worst drop −23%.
- Buy-and-hold 18.7% a year, worst drop −35%.
- SPY since 2000:
- Ladder 7.3% a year, worst drop −35%.
- Buy-and-hold 8.3% a year, worst drop −55%.
- SPY since 2010:
- Ladder 10.9% a year, worst drop −27%.
- Buy-and-hold 14.0% a year, worst drop −34%.
- 2025 to Oct 2026:
- QQQ: ladder +28% vs buy-and-hold +39%.
- SPY: ladder +23% vs +32%.
- In strong bull years it lags buy-and-hold. Since 2010 the gap is about 3–4% a year. The benefit is a smaller worst drop and earlier re-entry after crashes.
- Choppy bear markets whipsaw it. In 2022 SPY lost about as much as buy-and-hold. In 2020 SPY it ended slightly negative while buy-and-hold made +18%.
Tips:
- It was built and tested on daily charts of broad US index ETFs.
- For other markets, turn off the VIX warning.
- Use it as a guide for how heavy to be, together with your own plan.
Credits:
- SuperTrend: Olivier Seban. The band and flip code is based on KivancOzbilgic's open-source SuperTrend, which credits everget.
- Williams VIX Fix (mood reading only): Larry Williams. The spike code is based on ChrisMoody's CM_Williams_Vix_Fix.
- The risk check and ladder are my own. They build on my earlier free scripts, Trend Safety Switch and Market Fear Meter.
Disclaimer:
- This is for education only and is not financial advice.
- Backtests are hypothetical, and past results do not predict future results.
- Trading involves risk of loss.
Next: I'll post this ladder's live signals on QQQ and SPY here as they happen, good and bad, so you can judge it in real time.
Catatan Rilis
v1.1- VIX fix: the risk check now always uses the VIX close of the same trading day as the chart bar. On a live last bar (for example during overnight trading) the VIX feed could be on a different day, which could show a wrong warning count in the Now readout. Past bars, signals and the results table are unchanged.
- The Now readout now shows the VIX value and its percentile of the past year.
- Corrected the QQQ since 2000 backtest in the description: +792% (8.5% a year), worst drop -64%, vs buy-and-hold +817% (8.6% a year), -83%. The earlier figure came from a test model that started later in 2000. Other results are unchanged.

Pernyataan Penyangkalan
Informasi dan publikasi ini tidak dimaksudkan, dan bukan merupakan, saran atau rekomendasi keuangan, investasi, trading, atau jenis lainnya yang diberikan atau didukung oleh TradingView. Baca selengkapnya di Ketentuan Penggunaan.
Pernyataan Penyangkalan
Informasi dan publikasi ini tidak dimaksudkan, dan bukan merupakan, saran atau rekomendasi keuangan, investasi, trading, atau jenis lainnya yang diberikan atau didukung oleh TradingView. Baca selengkapnya di Ketentuan Penggunaan.