OPEN-SOURCE SCRIPT
Claudia Rea inspired Price Grid
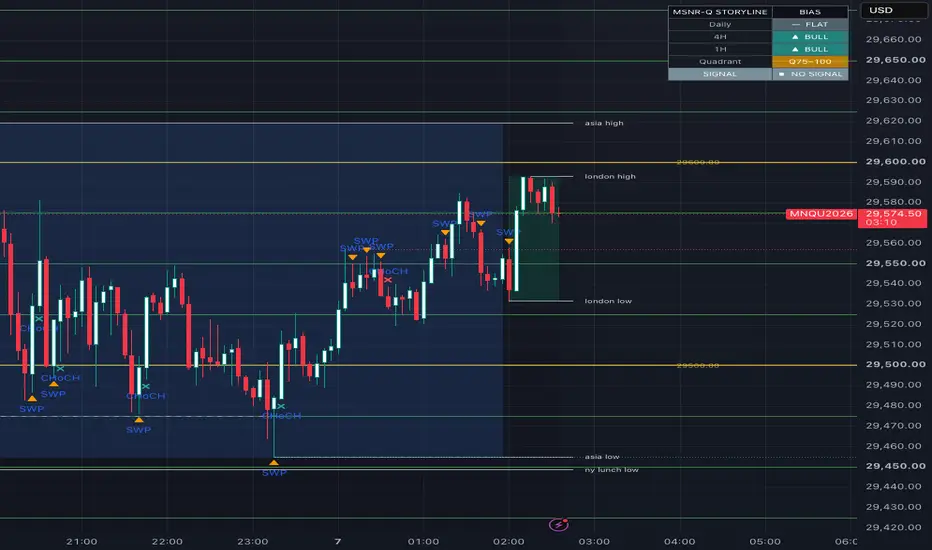
Inspired by Claudia Rea
Price Grid (Fixed Interval)
A configurable horizontal price grid that anchors to the current price and extends a fixed number of evenly-spaced levels above and below it — rather than to a fixed historical high/low, so the grid stays consistent regardless of timeframe or how much chart history has loaded.
How it works
Finds the nearest grid level below the current close, then draws lines at fixed Grid Spacing intervals above and below that anchor
Every Nth line (set by Major Line Every N Lines) is rendered thicker and in a different color, with a price label — useful for marking round numbers or larger intervals (e.g. $25 minor / $100 major) inside the same grid
Redraws only on the most recent bar, so it stays lightweight even on lower timeframes
Inputs
Grid Spacing — distance between minor lines
Major Line Every N Lines — how many minor steps between each major (labeled) line
Lines Above/Below Price — how many lines to draw on each side of price
Bars of History to Span Left — cosmetic only, controls how far left the lines are drawn
Show Price Labels / Extend Lines Right / line colors — display options
Notes
This is a purely mechanical price grid — it does not predict direction or generate signals. Round-number and fixed-interval levels can act as areas of interest on some instruments, but reactions at any given line are not guaranteed and should be combined with your own market structure analysis.
Works on any symbol or timeframe; grid spacing should be adjusted to match the instrument's typical volatility (e.g. smaller spacing for lower-priced or less volatile instruments).
Skrip open-source
Dengan semangat TradingView yang sesungguhnya, pembuat skrip ini telah menjadikannya sebagai sumber terbuka, sehingga para trader dapat meninjau dan memverifikasi fungsinya. Salut untuk penulisnya! Meskipun Anda dapat menggunakannya secara gratis, perlu diingat bahwa penerbitan ulang kode ini tunduk pada Tata Tertib kami.

Pernyataan Penyangkalan
Informasi dan publikasi ini tidak dimaksudkan, dan bukan merupakan, saran atau rekomendasi keuangan, investasi, trading, atau jenis lainnya yang diberikan atau didukung oleh TradingView. Baca selengkapnya di Ketentuan Penggunaan.
Skrip open-source
Dengan semangat TradingView yang sesungguhnya, pembuat skrip ini telah menjadikannya sebagai sumber terbuka, sehingga para trader dapat meninjau dan memverifikasi fungsinya. Salut untuk penulisnya! Meskipun Anda dapat menggunakannya secara gratis, perlu diingat bahwa penerbitan ulang kode ini tunduk pada Tata Tertib kami.
Pernyataan Penyangkalan
Informasi dan publikasi ini tidak dimaksudkan, dan bukan merupakan, saran atau rekomendasi keuangan, investasi, trading, atau jenis lainnya yang diberikan atau didukung oleh TradingView. Baca selengkapnya di Ketentuan Penggunaan.