HTF Sweep CISD Setups [WillyAlgoTrader]
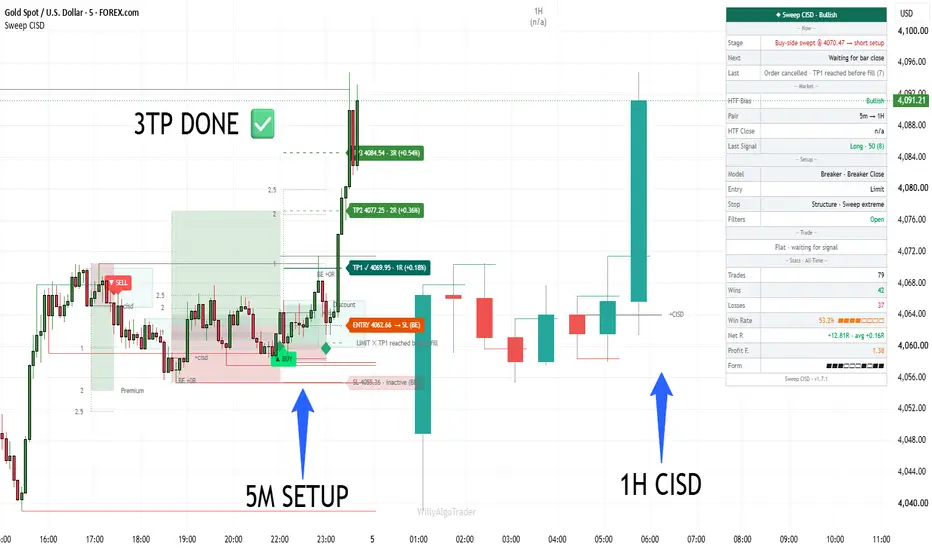
🎯 HTF Sweep CISD Setups is an overlay indicator that waits for liquidity to be taken on a higher timeframe and then hunts for a precise ICT entry on your chart timeframe. It combines a higher-timeframe sweep engine, a change-in-state-of-delivery (CISD) detector, five PD-array entry models (Order Block, FVG, IFVG, Breaker, Unicorn), quality and context filters, and a complete trade engine with limit orders, three targets, break-even and statistics in R. When a setup is valid, it is drawn on the chart with entry, stop and targets, and the dashboard tells you exactly what happens next.
The core insight: a sweep alone is not a trade, and a fair value gap alone is not a trade. The edge most ICT traders look for lives in the sequence — liquidity is taken on the higher timeframe, delivery flips on the lower timeframe, and price returns to the array that caused the flip. This indicator enforces that sequence bar by bar, the same way every time, and shows you why a setup was taken or rejected.
Works on futures, indices, forex, crypto and stocks. Built for 1m–15m charts paired with 15m–4H, and usable on any intraday timeframe.
🧩 WHY THESE COMPONENTS WORK TOGETHER
A higher-timeframe level tells you where liquidity rests, but not when to act. A lower-timeframe FVG or order block tells you where price might react, but not whether it is the right side of the market. A risk calculator sizes a trade, but cannot tell you whether the trade still makes sense after the market has moved. Used separately, these tools produce many signals and little context.
This indicator chains them into one decision pipeline:
HTF candle aggregation → Liquidity sweep trigger → Structure tracking from the swept extreme → CISD / PD-array detection → Quality & context filters → Trade plan (entry, stop, TP1–TP3) → Limit order & trade engine → Statistics in R
The sweep defines direction and timing. The swept extreme becomes the anchor from which all lower-timeframe structure is measured, so only arrays formed after the sweep are allowed. CISD confirms that delivery actually changed. The PD array sets a precise entry price instead of chasing the move. Filters reject setups whose stop is too tight or too wide, whose entry was already traded, or which sit on the wrong side of the dealing range. The trade engine then manages the plan exactly as written and records the real result in R.
Without the sweep, the entry models fire everywhere. Without the anchor, old arrays from the previous leg contaminate the setup. Without the filters, every tiny gap becomes a trade. Without the engine, you never find out what the setups actually return.
🔍 WHAT MAKES IT ORIGINAL
1️⃣ Self-built HTF candles with live sweep detection.
Higher-timeframe candles are aggregated directly from chart bars instead of being requested from another timeframe. This lets the indicator see the exact chart bar that takes a level and the bar where the HTF high or low was made.
— Auto pairing: under 1m → 5m, 1m → 15m, 2–3m → 30m, 5m → 1H, up to 15m → 4H, up to 1H → D, up to 4H → W
— Triggers (any enabled one fires): sweep of the previous HTF high/low, sweep + close back inside the previous candle's body (both body edges checked), sweep of any untaken HTF high/low within the last 10 HTF candles, and a confirmed 3-candle HTF pivot
— Optional "Wait for HTF candle to close" evaluates triggers only on HTF close
— The first aggregated HTF candle (usually partial) is ignored
Why this matters: the sweep bar and the swept level are known exactly, so the stop, the liquidity line and the structure anchor all refer to real prices.
2️⃣ Structure anchored to the swept extreme.
After a trigger, the indicator replays the bars from the anchor (the sweep bar, or the start of the HTF candle in wait-for-close mode) plus 30 bars before it, up to 450 bars, and from then on tracks the lowest low (long) or highest high (short) as the anchor. Every new extreme resets the found arrays — structure from the previous leg is never reused.
Long and short use one engine: short prices are mirrored (open → −open, high → −low, low → −high, close → −close), so both sides follow identical rules.
3️⃣ CISD with a displacement requirement.
The run of opposite-colored candles that delivered the extreme is stored. CISD is confirmed when a candle closes beyond the open of the first candle of that run:
— Long CISD: close > open of the first bearish candle of the run
— Displacement: candle body in the trade direction (close − open for longs) ≥ 0.5 × ATR(14) (default)
— A weak cross is ignored and a later, stronger candle can still confirm
— A close back below the run low cancels the CISD; it can re-form
4️⃣ Five PD-array entry models, 18 entry prices.
— Order Block: high/low, CISD open, mean threshold = (run open + lowest run close) / 2, crossed-candle high/low or close
— FVG: long gap when low[0] > high[2], first candle at or after the extreme, size ≥ 0.1 × ATR. Entry at the near edge, 50% (c.e.) or far edge
— IFVG: an opposing gap (high[0] < low[2], same minimum size) closed through by a displacement candle after the sweep. Candidates live 120 bars; a weak close does not consume them
— Breaker: close beyond the last confirmed swing (pivot length 3) formed before the extreme, with displacement. With "Require Pivot" off, the candle before the OB run is used (ICT breaker candle)
— Unicorn: breaker and FVG overlap, min(breaker top, FVG top) > max(breaker bottom, FVG bottom); entry at the top of the overlap
Failed arrays are cancelled when price closes back through them. Any combination of OB/CISD, FVG, FVG-after-OB-open (gap formed beyond the OB open during the CISD move), IFVG, Breaker and Unicorn can be made mandatory.
The "Crossed Candle" options use the candle that confirmed the array (the CISD displacement candle for FVG and Unicorn entries). If the array chosen for the structure stop does not exist, the stop falls back to the swept extreme and the label says so.
5️⃣ Quality filters that explain themselves.
— Risk band: 0.25 ≤ (entry − stop) / ATR ≤ 3.0 (defaults)
— Stale-entry rejection: in limit mode, if price already traded back to the entry between the array forming and the setup confirming, the setup is skipped
— Kill zones (Asia 20:00–00:00, London 02:00–05:00, NY AM 08:30–11:00, NY PM 13:30–16:00, New York time), ICT macros (xx:50–xx:10), two manual news block windows
— Volatility band: ATR percentile over 500 bars; the filter waits until the percentile is valid
— Optional HTF-bias filter, first sweep per direction per day, daily signal cap (a placed limit order counts even if it is later cancelled; days follow the instrument's daily session)
Every rejection produces a readable reason in the dashboard, e.g. "Blocked: risk 3.4 ATR > max 3", "Waiting: IFVG", "Skipped: entry already traded".
6️⃣ Context: premium/discount, draw on liquidity and SMT.
— Premium/discount: EQ = (range high + range low) / 2 over the last 4 HTF candles or the previous day. Longs require entry < EQ, shorts entry > EQ (optional filter, always scored)
— Draw on liquidity: TP3 can be the nearest untaken HTF high/low or the first one at least 1.5R away and beyond TP1. Untaken PDH/PDL are included only if today has not traded through them. With a liquidity target, TP2 = (TP1 + TP3) / 2
— SMT divergence: auto pairs ES↔NQ, MES↔MNQ, YM/RTY → ES. The correlated low (long) around the swept level's bar (± max(2, pivot length) bars) is compared with its low since then. SMT = the other market did not take its matching level. Missing data never counts as a pass; in "Required" mode it blocks the setup
7️⃣ Confluence score 0–100.
Score = OB/CISD 15 + FVG 15 + IFVG 15 + Breaker 15 + Unicorn 10 + HTF bias aligned 10 + SMT 10 + correct premium/discount side 10.
HTF bias comes from the last closed HTF candle: close above the previous high → bullish, below the previous low → bearish, a sweep of the previous low that closes back above it → bullish (mirror for bearish), otherwise unchanged. The score is a confluence count, not a probability. It appears in the entry tooltip, in the dashboard ("Last Signal") and in the alert payload.
8️⃣ Trade plan with honest geometry.
— Entry: limit at the PD array (default) or market at the signal close. If price already passed the limit at confirmation, the trade opens at the close and is reported as market
— Stop: Structure (swept extreme or chosen array, optional buffer × ATR), Wick-Anchored = min(signal low − 0.25 ATR, entry − 0.5 ATR), or ATR = entry − 1.5 × ATR (Balanced preset)
— Risk = |entry − stop|. TPk = entry + direction × risk × multiplier. Presets: Conservative 1/2/4R, Balanced 1/2/3R, Aggressive 1.5/2.5/4R, Scalping 0.8/1.5/2R, Custom
— All prices are rounded to the instrument tick, then SL < entry < TP1 < TP2 < TP3 is re-validated
— Measured-move reference levels (1, 2, 2.5 by default, up to 8): in "Projected" mode 0 = CISD level and −1 = stop; in "Risk:Reward" mode 0 = entry and 1 = one risk unit. They are visual references, not targets
— The green reward box of each setup reaches TP2 by default (TP1 / TP2 / TP3 selectable)
9️⃣ A trade engine that models what really happens.
— One position at a time; same-direction signals are ignored; an opposite signal reverses the trade. Long and short on the same bar are skipped by default
— Limit orders fill on bars 1…60 after the signal; expiry is checked before the fill; the order is cancelled if TP1 is reached first, outside the time/volatility filters (default on) or on a new day (optional)
— Gaps decide the order inside a bar: an open beyond the limit fills at the open, an open beyond the stop exits at the open, an open beyond TP1 means the target came first
— The fill bar is checked for the stop; TP1 moves the stop to entry (break-even, effective from the next bar)
— Intrabar Conflict Model: Optimistic (default, targets first, but a bar that closes beyond the stop still closes the trade) or Conservative (stop first)
🔟 Statistics in R, not only win rate.
— Win rate = share of trades that touched TP1 (a TP1 hit rate). TP3, a break-even stop after TP1 and a reversal after TP1 count as wins; a stop or reversal before TP1 counts as a loss
— Result per trade: R = direction × (exit − entry) / risk − cost per trade (default 0R). Exit = TP3, stop, break-even, gap open or the close on a reversal
— Net R, average R and profit factor = gross winning R / gross losing R, for 24 hours, 30 days or all time, plus the last 10 results
1️⃣1️⃣ A chart that tells you the stage.
The "Now" card shows one of four stages — waiting for an HTF trigger, setup building after a sweep, limit order waiting, position open — plus the next expected event and the last event. Every level label names its source ("SL · Sweep extreme", "TP3 · HTF high 2.8R"), and an HTF candle panel on the right shows the paired timeframe with sweep marks, the latest HTF CISD (an HTF close beyond the open of the last opposite-colored HTF run) and a countdown to the HTF close (realtime only).
⚙️ HOW IT WORKS — CALCULATION FLOW
Step 1 — HTF candles: chart bars are grouped into HTF candles; untaken HTF highs and lows within the lookback are tracked as liquidity.
Step 2 — Trigger: a sweep (or HTF pivot) starts a long or short context and replays recent bars to rebuild structure.
Step 3 — Anchor: the swept extreme is tracked; a new extreme resets all found arrays.
Step 4 — Arrays: CISD, FVG, IFVG and Breaker are detected after the extreme with displacement and size checks; failed arrays are cancelled.
Step 5 — Build: the selected entry price and any required arrays must exist; stale entries are rejected.
Step 6 — Plan: stop, risk band, premium/discount, liquidity target, SMT and tick rounding are applied; the setup gets a score and a list of tags.
Step 7 — Signal: on bar close the trade engine accepts the plan — a limit order is placed or a market trade opens.
Step 8 — Management: fills, TP1–TP3, break-even, stops, reversals and cancellations are processed in a fixed order inside each bar.
Step 9 — Record: every closed trade is stored with its result in R; the dashboard and history marks update.
📖 HOW TO USE
🎯 Quick start:
1. Add the indicator to a 1m–15m chart. The HTF is paired automatically.
2. Pick your entry model in "Entry At" (default Breaker Close) and, if you want A+ setups only, tick the required arrays in Step 3.
3. Turn on the kill zones you trade in "Filters · Time & Quality".
4. Create one alert with "Any alert() function call" to receive orders, entries and exits.
5. Watch the "Now" card: it tells you whether you are waiting, building a setup, holding an order or in a trade.
👁️ Reading the chart:
— ◇ small diamond under / over a bar = a limit order was placed (not an entry yet). The dashed "LIMIT … bars left" line shows the order with its planned SL and TP1
— 🟢 ▲ BUY / 🔴 ▼ SELL = the actual entry: the limit fill bar, or the signal bar for market entries
— Red / green boxes = risk and reward of the setup (reward box to TP2 by default)
— Teal box = the PD array the entry comes from; grey boxes = other FVG / IFVG found
— "+cisd" / "−cisd" = the CISD level; dotted numbers = measured-move levels
— Teal / red horizontal lines = untaken HTF buy-side / sell-side liquidity; the swept level is extended to the setup
— ENTRY / SL / TP1–TP3 labels with source and % distance; a reached target turns teal with ✓
— After break-even the original SL is greyed as "inactive (BE)" and the entry label shows "→ SL (BE)"
— "TP3 +2.0R", "SL −1.0R", "BE +0R", "REV +0.4R" above / below the exit bar = trade outcome in R
— Grey horizontal line from the swept extreme = the extreme is still intact; it stops where price trades through it (30 most recent)
— Two grey lines from the last closed HTF candle = its high and low
— Tags next to a setup: "Discount" / "Premium" (correct side of the range), "DOL 2.4R" (liquidity target and its R), "SMT", "SMT n/a" (no data), "partial history" (the structure replay reached its 450-bar limit)
— Grey setup boxes (optional) = valid setups ignored because a same-direction trade or order was already open; blue boxes (optional Live Preview) = setup forming on the open bar
— HTF candles on the right: teal / red marks = sweeps of the previous HTF high / low, "+CISD / −CISD" = latest HTF CISD
📊 Dashboard fields:
— Now: Stage, Next (or the exact reason no setup is taken; hover for long and short), Last event
— Market: HTF bias, timeframe pair, time to HTF close, last signal with score
— Setup: entry model, entry mode, stop mode, filter state
— Trade: entry, SL (BE @ after break-even), TP1–TP3 with ✓, R:R at TP1, SL distance % to the current stop; otherwise "Pending long @ price · N bars" or "Flat · waiting for signal"
— Stats: trades, wins, losses, win rate (TP1 hit rate), Net R with average, profit factor, last 10 results
🔧 Tuning guide:
— Too few setups: lower "Displacement Body" to 0.3, untick required arrays, or set "Entry At" to an FVG model
— Too many weak setups: require CISD + FVG or Breaker, enable kill zones and "Only in Direction of HTF Bias"
— Stops too tight / too wide: adjust "Min Risk" / "Max Risk" in ATR or switch the SL mode
— Targets too ambitious: use "Nearest HTF liquidity" with min R:R 1.5
— Index futures: start with SMT "Mark only", compare results with and without the SMT tag, then decide on "Required"
— Realistic stats: set "Cost per Trade" to your commission + slippage in R and compare the Optimistic and Conservative intrabar models
⚙️ KEY SETTINGS
⚙️ Main Settings:
— Auto Paired HTF (default on) / Manual HTF (60)
— Direction (Both)
— LTF Pivot Length (3): swing confirmation for breakers
— Max Bars to Wait for Setup (36) and Max Context Age (120)
— Structure Lookback Before Trigger (30), FVG Lifetime for Inversion (120)
🕐 Step 1 · HTF Condition:
— Wait for HTF Candle to Close (off)
— Sweep of Previous High/Low (on), Sweep + Close Back Into Body (off), Sweep of Any Previous High/Low (on, lookback 10 HTF candles), New Short Term Pivot (off)
🎯 Step 2 · Setup Entry:
— Entry At (Breaker Close): 18 options across OB, FVG, IFVG, Breaker, Unicorn
— Structure Stop At (Pivot Point = swept extreme), Structure Stop Buffer (0 × ATR)
— Measured-Move Levels (Projected, "1, 2, 2.5", max 8)
— Cancel Unfilled Limit After (60 bars)
🧩 Step 3 · Required PD Arrays:
— OB / CISD Cross, Any FVG, FVG After OB Open, IFVG, Breaker Block (Require Pivot on), Unicorn — all off by default
🔍 Filters · Time & Quality:
— Kill zones, ICT macros, two news block windows (all off, timezone America/New_York)
— ATR Length (14), Min Risk (0.25 ATR), Max Risk (3.0 ATR)
— Displacement Body (0.5 ATR), Min FVG Size (0.1 ATR)
— Skip Already-Traded Entries (on), Cancel Pending Outside Filters (on), Cancel Pending on New Day (off)
— Same-Bar Long & Short (Skip both), Only First Sweep per Day (off), Max Signals per Day (0 = off), Only in Direction of HTF Bias (off)
🧭 Filters · Context:
— Premium / Discount Filter (Off; HTF range 4 candles or previous day)
— Final Target (TP3) (Fixed R; or nearest / first HTF liquidity, min R:R 1.5, PDH/PDL included, fallback to Fixed R)
— SMT Divergence (Off; Mark only / Required), correlated symbol auto or manual
— ATR Percentile (lookback 500, min 0, max 100)
🛡️ Risk Management:
— Entry Mode (Limit), SL Mode (Structure), Risk Preset (Balanced: 1R / 2R / 3R)
— Break-Even After TP1 (on), Intrabar Conflict Model (Optimistic), Cost per Trade (0R)
— Custom preset: SL ×ATR (1.5), TP1 / TP2 / TP3 ×risk (1 / 2 / 3)
— Setup Reward Box To (TP2), Show SL/TP Lines, Pending Limit Order, Trade Outcomes, SL/TP Labels, % Distance (all on), line styles Entry Dotted / SL Solid / TP Dashed
🎨 Visual Settings:
— Theme (Auto — detected from chart background brightness; Dark; Light)
— Show Buy/Sell Labels, Setup Boxes, Entry PD Array Zone (extend 10 bars), CISD Mark, Swept Extreme Line, Context Tags, HTF Liquidity, Previous HTF High/Low (all on)
— Show Live Preview (off, repaints), Show Setups Ignored by Trade Engine (off), Draw Setup From Confirmation Bar (off), Keep Swept Levels (off)
— Max Setups on Chart (40): older setup drawings and marks are removed to stay within Pine's 500-object limits; Setup Width (4 bars)
— Label sizes for signals and for SL/TP & level labels (Small), watermark toggle
🕯️ HTF Panel:
— 8 candles, offset 15 bars, candle width 5, gap 3, candle times (off), countdown (on), HTF CISD (on)
📊 Dashboard:
— Position (Top Right), font size (Small), sections Now / Market / Setup / Trade / Stats with individual toggles, Win Rate Period (All-Time; 24 Hours; 30 Days)
🔔 Alerts & Colors:
— Webhook JSON (off), TP / Break-Even (on), SL Hit / TP3 / Reversal (on), Limit Fill / Cancel (on), HTF Bias Flip (off), HTF Sweep (off)
— Bull / Bear label colors, HTF panel up / down, buy-side / sell-side liquidity, entry zone
🔔 ALERTS
Create one alert with "Any alert() function call". Inside a bar, messages arrive in this order:
— 🛡️ BREAK-EVEN, 🎯 TP1 HIT, 🎯🎯 TP2 HIT
— 🏆 TP3 HIT, 🛑 SL HIT / 🛡️ BE STOP-OUT — with exit price and result in R
— 🔄 REVERSAL — closed after / before TP1, result in R
— ⚪ ORDER CANCELLED — with reason (expired, TP1 reached before fill, outside filters, new day, opposite signal); 🕓 LIMIT PLACED; 🟢 LONG ENTRY / 🔴 SHORT ENTRY — with entry, SL, TP1–TP3, R:R and score; 🛑 SL HIT "stopped on the fill bar" when a fill is stopped out immediately
— Optional: HTF bias flip, HTF sweep
Each group can be switched off in the Alerts settings. "Webhook JSON Format" turns every alert into JSON with schema_version, event (order, fill, be, tp1, tp2, tp3, sl, reversal_close, cancel, bias, sweep), event_id, trade_id, order_id, side, ticker, tf, bar_time, price levels, R and reason (the order event carries type "limit" or "market"; stop events carry reason "sl", "be_stop" or "fill_bar_stop"). A replaced order is cancelled before the new order is sent. All alerts fire once per bar close.
⚠️ IMPORTANT NOTES
— 🚫 No repainting of signals. Orders, entries, exits and alerts are produced on confirmed bars only (barstate.isconfirmed, alert.freq_once_per_bar_close). HTF candles are built from chart bars, not requested with lookahead. The SMT symbol is requested on the same timeframe with lookahead off.
— 📐 Delayed confirmation is not repainting. LTF pivots need 3 bars on each side, so breakers based on pivots are known with that delay. Setup boxes are drawn from the start of the OB / CISD run for context; the ◇ / ▲ ▼ markers show when the order and the entry actually happened. Enable "Draw Setup From Confirmation Bar" to avoid any back-drawing. The optional Live Preview draws forming setups on the open bar and may change before the close.
— 📐 Statistics are a model. OHLC cannot show the order of prices inside a bar; the chosen intrabar model and the gap rules decide it. Partial exits and position sizing are not modelled, statistics reset on chart reload, and they are not a backtest. Past performance does not guarantee future results.
— 🧯 Input validation. Contradictory settings stop the script with a clear message instead of silently misbehaving: TP1 < TP2 < TP3, HTF higher than the chart, Min Risk < Max Risk, Min < Max ATR percentile, Max Context Age ≥ Max Bars to Wait, HTF panel within 480 bars ahead, at most 8 measured-move levels.
— 📐 History depth. Structure is rebuilt from at most 450 bars; a setup that needed more is tagged "partial history". The first, usually incomplete HTF candle on the chart is ignored.
— ⚖️ Scope. The break-even stop is a price level: after costs the result can be slightly negative. A limit fill is a model event, not a broker confirmation. Pine has no economic calendar — news windows are set manually.
— 🛠️ This is a setup detection and trade-planning tool, not an automated trading bot. It finds HTF sweeps, confirms CISD and PD-array entries, and plans entry, stop and targets — trade decisions remain yours.
— 🌐 Works on all markets with OHLC data (futures, indices, forex, crypto, stocks) and on all intraday timeframes; the HTF must be higher than the chart timeframe.
The core insight: a sweep alone is not a trade, and a fair value gap alone is not a trade. The edge most ICT traders look for lives in the sequence — liquidity is taken on the higher timeframe, delivery flips on the lower timeframe, and price returns to the array that caused the flip. This indicator enforces that sequence bar by bar, the same way every time, and shows you why a setup was taken or rejected.
Works on futures, indices, forex, crypto and stocks. Built for 1m–15m charts paired with 15m–4H, and usable on any intraday timeframe.
🧩 WHY THESE COMPONENTS WORK TOGETHER
A higher-timeframe level tells you where liquidity rests, but not when to act. A lower-timeframe FVG or order block tells you where price might react, but not whether it is the right side of the market. A risk calculator sizes a trade, but cannot tell you whether the trade still makes sense after the market has moved. Used separately, these tools produce many signals and little context.
This indicator chains them into one decision pipeline:
HTF candle aggregation → Liquidity sweep trigger → Structure tracking from the swept extreme → CISD / PD-array detection → Quality & context filters → Trade plan (entry, stop, TP1–TP3) → Limit order & trade engine → Statistics in R
The sweep defines direction and timing. The swept extreme becomes the anchor from which all lower-timeframe structure is measured, so only arrays formed after the sweep are allowed. CISD confirms that delivery actually changed. The PD array sets a precise entry price instead of chasing the move. Filters reject setups whose stop is too tight or too wide, whose entry was already traded, or which sit on the wrong side of the dealing range. The trade engine then manages the plan exactly as written and records the real result in R.
Without the sweep, the entry models fire everywhere. Without the anchor, old arrays from the previous leg contaminate the setup. Without the filters, every tiny gap becomes a trade. Without the engine, you never find out what the setups actually return.
🔍 WHAT MAKES IT ORIGINAL
1️⃣ Self-built HTF candles with live sweep detection.
Higher-timeframe candles are aggregated directly from chart bars instead of being requested from another timeframe. This lets the indicator see the exact chart bar that takes a level and the bar where the HTF high or low was made.
— Auto pairing: under 1m → 5m, 1m → 15m, 2–3m → 30m, 5m → 1H, up to 15m → 4H, up to 1H → D, up to 4H → W
— Triggers (any enabled one fires): sweep of the previous HTF high/low, sweep + close back inside the previous candle's body (both body edges checked), sweep of any untaken HTF high/low within the last 10 HTF candles, and a confirmed 3-candle HTF pivot
— Optional "Wait for HTF candle to close" evaluates triggers only on HTF close
— The first aggregated HTF candle (usually partial) is ignored
Why this matters: the sweep bar and the swept level are known exactly, so the stop, the liquidity line and the structure anchor all refer to real prices.
2️⃣ Structure anchored to the swept extreme.
After a trigger, the indicator replays the bars from the anchor (the sweep bar, or the start of the HTF candle in wait-for-close mode) plus 30 bars before it, up to 450 bars, and from then on tracks the lowest low (long) or highest high (short) as the anchor. Every new extreme resets the found arrays — structure from the previous leg is never reused.
Long and short use one engine: short prices are mirrored (open → −open, high → −low, low → −high, close → −close), so both sides follow identical rules.
3️⃣ CISD with a displacement requirement.
The run of opposite-colored candles that delivered the extreme is stored. CISD is confirmed when a candle closes beyond the open of the first candle of that run:
— Long CISD: close > open of the first bearish candle of the run
— Displacement: candle body in the trade direction (close − open for longs) ≥ 0.5 × ATR(14) (default)
— A weak cross is ignored and a later, stronger candle can still confirm
— A close back below the run low cancels the CISD; it can re-form
4️⃣ Five PD-array entry models, 18 entry prices.
— Order Block: high/low, CISD open, mean threshold = (run open + lowest run close) / 2, crossed-candle high/low or close
— FVG: long gap when low[0] > high[2], first candle at or after the extreme, size ≥ 0.1 × ATR. Entry at the near edge, 50% (c.e.) or far edge
— IFVG: an opposing gap (high[0] < low[2], same minimum size) closed through by a displacement candle after the sweep. Candidates live 120 bars; a weak close does not consume them
— Breaker: close beyond the last confirmed swing (pivot length 3) formed before the extreme, with displacement. With "Require Pivot" off, the candle before the OB run is used (ICT breaker candle)
— Unicorn: breaker and FVG overlap, min(breaker top, FVG top) > max(breaker bottom, FVG bottom); entry at the top of the overlap
Failed arrays are cancelled when price closes back through them. Any combination of OB/CISD, FVG, FVG-after-OB-open (gap formed beyond the OB open during the CISD move), IFVG, Breaker and Unicorn can be made mandatory.
The "Crossed Candle" options use the candle that confirmed the array (the CISD displacement candle for FVG and Unicorn entries). If the array chosen for the structure stop does not exist, the stop falls back to the swept extreme and the label says so.
5️⃣ Quality filters that explain themselves.
— Risk band: 0.25 ≤ (entry − stop) / ATR ≤ 3.0 (defaults)
— Stale-entry rejection: in limit mode, if price already traded back to the entry between the array forming and the setup confirming, the setup is skipped
— Kill zones (Asia 20:00–00:00, London 02:00–05:00, NY AM 08:30–11:00, NY PM 13:30–16:00, New York time), ICT macros (xx:50–xx:10), two manual news block windows
— Volatility band: ATR percentile over 500 bars; the filter waits until the percentile is valid
— Optional HTF-bias filter, first sweep per direction per day, daily signal cap (a placed limit order counts even if it is later cancelled; days follow the instrument's daily session)
Every rejection produces a readable reason in the dashboard, e.g. "Blocked: risk 3.4 ATR > max 3", "Waiting: IFVG", "Skipped: entry already traded".
6️⃣ Context: premium/discount, draw on liquidity and SMT.
— Premium/discount: EQ = (range high + range low) / 2 over the last 4 HTF candles or the previous day. Longs require entry < EQ, shorts entry > EQ (optional filter, always scored)
— Draw on liquidity: TP3 can be the nearest untaken HTF high/low or the first one at least 1.5R away and beyond TP1. Untaken PDH/PDL are included only if today has not traded through them. With a liquidity target, TP2 = (TP1 + TP3) / 2
— SMT divergence: auto pairs ES↔NQ, MES↔MNQ, YM/RTY → ES. The correlated low (long) around the swept level's bar (± max(2, pivot length) bars) is compared with its low since then. SMT = the other market did not take its matching level. Missing data never counts as a pass; in "Required" mode it blocks the setup
7️⃣ Confluence score 0–100.
Score = OB/CISD 15 + FVG 15 + IFVG 15 + Breaker 15 + Unicorn 10 + HTF bias aligned 10 + SMT 10 + correct premium/discount side 10.
HTF bias comes from the last closed HTF candle: close above the previous high → bullish, below the previous low → bearish, a sweep of the previous low that closes back above it → bullish (mirror for bearish), otherwise unchanged. The score is a confluence count, not a probability. It appears in the entry tooltip, in the dashboard ("Last Signal") and in the alert payload.
8️⃣ Trade plan with honest geometry.
— Entry: limit at the PD array (default) or market at the signal close. If price already passed the limit at confirmation, the trade opens at the close and is reported as market
— Stop: Structure (swept extreme or chosen array, optional buffer × ATR), Wick-Anchored = min(signal low − 0.25 ATR, entry − 0.5 ATR), or ATR = entry − 1.5 × ATR (Balanced preset)
— Risk = |entry − stop|. TPk = entry + direction × risk × multiplier. Presets: Conservative 1/2/4R, Balanced 1/2/3R, Aggressive 1.5/2.5/4R, Scalping 0.8/1.5/2R, Custom
— All prices are rounded to the instrument tick, then SL < entry < TP1 < TP2 < TP3 is re-validated
— Measured-move reference levels (1, 2, 2.5 by default, up to 8): in "Projected" mode 0 = CISD level and −1 = stop; in "Risk:Reward" mode 0 = entry and 1 = one risk unit. They are visual references, not targets
— The green reward box of each setup reaches TP2 by default (TP1 / TP2 / TP3 selectable)
9️⃣ A trade engine that models what really happens.
— One position at a time; same-direction signals are ignored; an opposite signal reverses the trade. Long and short on the same bar are skipped by default
— Limit orders fill on bars 1…60 after the signal; expiry is checked before the fill; the order is cancelled if TP1 is reached first, outside the time/volatility filters (default on) or on a new day (optional)
— Gaps decide the order inside a bar: an open beyond the limit fills at the open, an open beyond the stop exits at the open, an open beyond TP1 means the target came first
— The fill bar is checked for the stop; TP1 moves the stop to entry (break-even, effective from the next bar)
— Intrabar Conflict Model: Optimistic (default, targets first, but a bar that closes beyond the stop still closes the trade) or Conservative (stop first)
🔟 Statistics in R, not only win rate.
— Win rate = share of trades that touched TP1 (a TP1 hit rate). TP3, a break-even stop after TP1 and a reversal after TP1 count as wins; a stop or reversal before TP1 counts as a loss
— Result per trade: R = direction × (exit − entry) / risk − cost per trade (default 0R). Exit = TP3, stop, break-even, gap open or the close on a reversal
— Net R, average R and profit factor = gross winning R / gross losing R, for 24 hours, 30 days or all time, plus the last 10 results
1️⃣1️⃣ A chart that tells you the stage.
The "Now" card shows one of four stages — waiting for an HTF trigger, setup building after a sweep, limit order waiting, position open — plus the next expected event and the last event. Every level label names its source ("SL · Sweep extreme", "TP3 · HTF high 2.8R"), and an HTF candle panel on the right shows the paired timeframe with sweep marks, the latest HTF CISD (an HTF close beyond the open of the last opposite-colored HTF run) and a countdown to the HTF close (realtime only).
⚙️ HOW IT WORKS — CALCULATION FLOW
Step 1 — HTF candles: chart bars are grouped into HTF candles; untaken HTF highs and lows within the lookback are tracked as liquidity.
Step 2 — Trigger: a sweep (or HTF pivot) starts a long or short context and replays recent bars to rebuild structure.
Step 3 — Anchor: the swept extreme is tracked; a new extreme resets all found arrays.
Step 4 — Arrays: CISD, FVG, IFVG and Breaker are detected after the extreme with displacement and size checks; failed arrays are cancelled.
Step 5 — Build: the selected entry price and any required arrays must exist; stale entries are rejected.
Step 6 — Plan: stop, risk band, premium/discount, liquidity target, SMT and tick rounding are applied; the setup gets a score and a list of tags.
Step 7 — Signal: on bar close the trade engine accepts the plan — a limit order is placed or a market trade opens.
Step 8 — Management: fills, TP1–TP3, break-even, stops, reversals and cancellations are processed in a fixed order inside each bar.
Step 9 — Record: every closed trade is stored with its result in R; the dashboard and history marks update.
📖 HOW TO USE
🎯 Quick start:
1. Add the indicator to a 1m–15m chart. The HTF is paired automatically.
2. Pick your entry model in "Entry At" (default Breaker Close) and, if you want A+ setups only, tick the required arrays in Step 3.
3. Turn on the kill zones you trade in "Filters · Time & Quality".
4. Create one alert with "Any alert() function call" to receive orders, entries and exits.
5. Watch the "Now" card: it tells you whether you are waiting, building a setup, holding an order or in a trade.
👁️ Reading the chart:
— ◇ small diamond under / over a bar = a limit order was placed (not an entry yet). The dashed "LIMIT … bars left" line shows the order with its planned SL and TP1
— 🟢 ▲ BUY / 🔴 ▼ SELL = the actual entry: the limit fill bar, or the signal bar for market entries
— Red / green boxes = risk and reward of the setup (reward box to TP2 by default)
— Teal box = the PD array the entry comes from; grey boxes = other FVG / IFVG found
— "+cisd" / "−cisd" = the CISD level; dotted numbers = measured-move levels
— Teal / red horizontal lines = untaken HTF buy-side / sell-side liquidity; the swept level is extended to the setup
— ENTRY / SL / TP1–TP3 labels with source and % distance; a reached target turns teal with ✓
— After break-even the original SL is greyed as "inactive (BE)" and the entry label shows "→ SL (BE)"
— "TP3 +2.0R", "SL −1.0R", "BE +0R", "REV +0.4R" above / below the exit bar = trade outcome in R
— Grey horizontal line from the swept extreme = the extreme is still intact; it stops where price trades through it (30 most recent)
— Two grey lines from the last closed HTF candle = its high and low
— Tags next to a setup: "Discount" / "Premium" (correct side of the range), "DOL 2.4R" (liquidity target and its R), "SMT", "SMT n/a" (no data), "partial history" (the structure replay reached its 450-bar limit)
— Grey setup boxes (optional) = valid setups ignored because a same-direction trade or order was already open; blue boxes (optional Live Preview) = setup forming on the open bar
— HTF candles on the right: teal / red marks = sweeps of the previous HTF high / low, "+CISD / −CISD" = latest HTF CISD
📊 Dashboard fields:
— Now: Stage, Next (or the exact reason no setup is taken; hover for long and short), Last event
— Market: HTF bias, timeframe pair, time to HTF close, last signal with score
— Setup: entry model, entry mode, stop mode, filter state
— Trade: entry, SL (BE @ after break-even), TP1–TP3 with ✓, R:R at TP1, SL distance % to the current stop; otherwise "Pending long @ price · N bars" or "Flat · waiting for signal"
— Stats: trades, wins, losses, win rate (TP1 hit rate), Net R with average, profit factor, last 10 results
🔧 Tuning guide:
— Too few setups: lower "Displacement Body" to 0.3, untick required arrays, or set "Entry At" to an FVG model
— Too many weak setups: require CISD + FVG or Breaker, enable kill zones and "Only in Direction of HTF Bias"
— Stops too tight / too wide: adjust "Min Risk" / "Max Risk" in ATR or switch the SL mode
— Targets too ambitious: use "Nearest HTF liquidity" with min R:R 1.5
— Index futures: start with SMT "Mark only", compare results with and without the SMT tag, then decide on "Required"
— Realistic stats: set "Cost per Trade" to your commission + slippage in R and compare the Optimistic and Conservative intrabar models
⚙️ KEY SETTINGS
⚙️ Main Settings:
— Auto Paired HTF (default on) / Manual HTF (60)
— Direction (Both)
— LTF Pivot Length (3): swing confirmation for breakers
— Max Bars to Wait for Setup (36) and Max Context Age (120)
— Structure Lookback Before Trigger (30), FVG Lifetime for Inversion (120)
🕐 Step 1 · HTF Condition:
— Wait for HTF Candle to Close (off)
— Sweep of Previous High/Low (on), Sweep + Close Back Into Body (off), Sweep of Any Previous High/Low (on, lookback 10 HTF candles), New Short Term Pivot (off)
🎯 Step 2 · Setup Entry:
— Entry At (Breaker Close): 18 options across OB, FVG, IFVG, Breaker, Unicorn
— Structure Stop At (Pivot Point = swept extreme), Structure Stop Buffer (0 × ATR)
— Measured-Move Levels (Projected, "1, 2, 2.5", max 8)
— Cancel Unfilled Limit After (60 bars)
🧩 Step 3 · Required PD Arrays:
— OB / CISD Cross, Any FVG, FVG After OB Open, IFVG, Breaker Block (Require Pivot on), Unicorn — all off by default
🔍 Filters · Time & Quality:
— Kill zones, ICT macros, two news block windows (all off, timezone America/New_York)
— ATR Length (14), Min Risk (0.25 ATR), Max Risk (3.0 ATR)
— Displacement Body (0.5 ATR), Min FVG Size (0.1 ATR)
— Skip Already-Traded Entries (on), Cancel Pending Outside Filters (on), Cancel Pending on New Day (off)
— Same-Bar Long & Short (Skip both), Only First Sweep per Day (off), Max Signals per Day (0 = off), Only in Direction of HTF Bias (off)
🧭 Filters · Context:
— Premium / Discount Filter (Off; HTF range 4 candles or previous day)
— Final Target (TP3) (Fixed R; or nearest / first HTF liquidity, min R:R 1.5, PDH/PDL included, fallback to Fixed R)
— SMT Divergence (Off; Mark only / Required), correlated symbol auto or manual
— ATR Percentile (lookback 500, min 0, max 100)
🛡️ Risk Management:
— Entry Mode (Limit), SL Mode (Structure), Risk Preset (Balanced: 1R / 2R / 3R)
— Break-Even After TP1 (on), Intrabar Conflict Model (Optimistic), Cost per Trade (0R)
— Custom preset: SL ×ATR (1.5), TP1 / TP2 / TP3 ×risk (1 / 2 / 3)
— Setup Reward Box To (TP2), Show SL/TP Lines, Pending Limit Order, Trade Outcomes, SL/TP Labels, % Distance (all on), line styles Entry Dotted / SL Solid / TP Dashed
🎨 Visual Settings:
— Theme (Auto — detected from chart background brightness; Dark; Light)
— Show Buy/Sell Labels, Setup Boxes, Entry PD Array Zone (extend 10 bars), CISD Mark, Swept Extreme Line, Context Tags, HTF Liquidity, Previous HTF High/Low (all on)
— Show Live Preview (off, repaints), Show Setups Ignored by Trade Engine (off), Draw Setup From Confirmation Bar (off), Keep Swept Levels (off)
— Max Setups on Chart (40): older setup drawings and marks are removed to stay within Pine's 500-object limits; Setup Width (4 bars)
— Label sizes for signals and for SL/TP & level labels (Small), watermark toggle
🕯️ HTF Panel:
— 8 candles, offset 15 bars, candle width 5, gap 3, candle times (off), countdown (on), HTF CISD (on)
📊 Dashboard:
— Position (Top Right), font size (Small), sections Now / Market / Setup / Trade / Stats with individual toggles, Win Rate Period (All-Time; 24 Hours; 30 Days)
🔔 Alerts & Colors:
— Webhook JSON (off), TP / Break-Even (on), SL Hit / TP3 / Reversal (on), Limit Fill / Cancel (on), HTF Bias Flip (off), HTF Sweep (off)
— Bull / Bear label colors, HTF panel up / down, buy-side / sell-side liquidity, entry zone
🔔 ALERTS
Create one alert with "Any alert() function call". Inside a bar, messages arrive in this order:
— 🛡️ BREAK-EVEN, 🎯 TP1 HIT, 🎯🎯 TP2 HIT
— 🏆 TP3 HIT, 🛑 SL HIT / 🛡️ BE STOP-OUT — with exit price and result in R
— 🔄 REVERSAL — closed after / before TP1, result in R
— ⚪ ORDER CANCELLED — with reason (expired, TP1 reached before fill, outside filters, new day, opposite signal); 🕓 LIMIT PLACED; 🟢 LONG ENTRY / 🔴 SHORT ENTRY — with entry, SL, TP1–TP3, R:R and score; 🛑 SL HIT "stopped on the fill bar" when a fill is stopped out immediately
— Optional: HTF bias flip, HTF sweep
Each group can be switched off in the Alerts settings. "Webhook JSON Format" turns every alert into JSON with schema_version, event (order, fill, be, tp1, tp2, tp3, sl, reversal_close, cancel, bias, sweep), event_id, trade_id, order_id, side, ticker, tf, bar_time, price levels, R and reason (the order event carries type "limit" or "market"; stop events carry reason "sl", "be_stop" or "fill_bar_stop"). A replaced order is cancelled before the new order is sent. All alerts fire once per bar close.
⚠️ IMPORTANT NOTES
— 🚫 No repainting of signals. Orders, entries, exits and alerts are produced on confirmed bars only (barstate.isconfirmed, alert.freq_once_per_bar_close). HTF candles are built from chart bars, not requested with lookahead. The SMT symbol is requested on the same timeframe with lookahead off.
— 📐 Delayed confirmation is not repainting. LTF pivots need 3 bars on each side, so breakers based on pivots are known with that delay. Setup boxes are drawn from the start of the OB / CISD run for context; the ◇ / ▲ ▼ markers show when the order and the entry actually happened. Enable "Draw Setup From Confirmation Bar" to avoid any back-drawing. The optional Live Preview draws forming setups on the open bar and may change before the close.
— 📐 Statistics are a model. OHLC cannot show the order of prices inside a bar; the chosen intrabar model and the gap rules decide it. Partial exits and position sizing are not modelled, statistics reset on chart reload, and they are not a backtest. Past performance does not guarantee future results.
— 🧯 Input validation. Contradictory settings stop the script with a clear message instead of silently misbehaving: TP1 < TP2 < TP3, HTF higher than the chart, Min Risk < Max Risk, Min < Max ATR percentile, Max Context Age ≥ Max Bars to Wait, HTF panel within 480 bars ahead, at most 8 measured-move levels.
— 📐 History depth. Structure is rebuilt from at most 450 bars; a setup that needed more is tagged "partial history". The first, usually incomplete HTF candle on the chart is ignored.
— ⚖️ Scope. The break-even stop is a price level: after costs the result can be slightly negative. A limit fill is a model event, not a broker confirmation. Pine has no economic calendar — news windows are set manually.
— 🛠️ This is a setup detection and trade-planning tool, not an automated trading bot. It finds HTF sweeps, confirms CISD and PD-array entries, and plans entry, stop and targets — trade decisions remain yours.
— 🌐 Works on all markets with OHLC data (futures, indices, forex, crypto, stocks) and on all intraday timeframes; the HTF must be higher than the chart timeframe.

10 years in trading. For all inquiries, contact me on my Telegram channel: t.me/WillyAlgoTrader or Instagram: @willytraderbtc
Pernyataan Penyangkalan
Informasi dan publikasi ini tidak dimaksudkan, dan bukan merupakan, saran atau rekomendasi keuangan, investasi, trading, atau jenis lainnya yang diberikan atau didukung oleh TradingView. Baca selengkapnya di Ketentuan Penggunaan.
10 years in trading. For all inquiries, contact me on my Telegram channel: t.me/WillyAlgoTrader or Instagram: @willytraderbtc
Pernyataan Penyangkalan
Informasi dan publikasi ini tidak dimaksudkan, dan bukan merupakan, saran atau rekomendasi keuangan, investasi, trading, atau jenis lainnya yang diberikan atau didukung oleh TradingView. Baca selengkapnya di Ketentuan Penggunaan.