Strong Magnet Zones PRO [Thomas]
1. INTRODUCTION
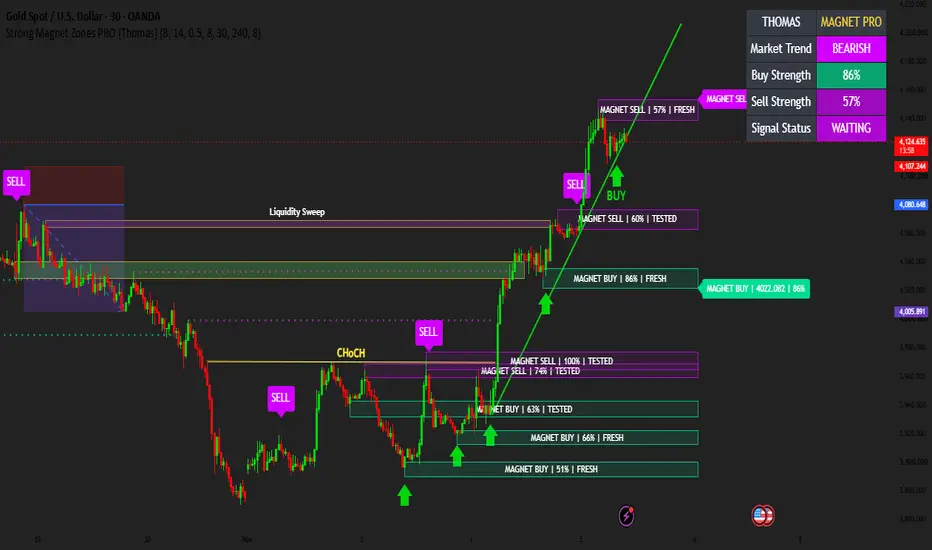
Strong Magnet Zones PRO [Thomas ] is an advanced technical analysis indicator developed to help traders identify potential market reaction areas, visualize important price zones, evaluate candle-based rejection conditions, and understand higher-timeframe market direction.
The indicator combines confirmed swing highs and swing lows, ATR-based zone calculations, relative volume analysis, wick characteristics, multi-timeframe EMA confirmation, and rejection-based signal conditions into one organized chart tool.
Its main objective is to provide a structured view of potential support and resistance areas without requiring traders to manually draw every important zone.
Instead of focusing on frequent signals, the indicator emphasizes potential reaction areas and additional market context.
It can be used for technical analysis of Gold, BTCUSD, Forex, and other liquid markets.
2. MAIN FEATURES
A. STRONG MAGNET BUY ZONES
The indicator automatically identifies potential bullish reaction areas using confirmed pivot lows.
A pivot low is detected when a candle forms a local swing low according to the selected Pivot Strength setting.
After confirmation, the indicator calculates a zone around that swing low using Average True Range (ATR).
The zone is displayed in green.
What this zone represents:
Potential support or demand reaction area.
A price region where buyers may become active.
An area to monitor for bullish rejection.
A reference for evaluating possible market reactions.
A green zone does not guarantee that price will reverse upward. Price may break through the zone.
B. STRONG MAGNET SELL ZONES
Sell zones are identified using confirmed pivot highs.
When a swing high is confirmed, the indicator calculates an ATR-based price region around that high.
The zone is displayed in purple.
What this zone represents:
Potential resistance or supply reaction area.
A region where selling pressure may appear.
An area to monitor for bearish rejection.
A reference for evaluating possible downside reactions.
A purple zone does not guarantee that price will reverse downward.
C. ATR-BASED ZONE CALCULATION
The indicator uses Average True Range (ATR) to calculate the width of each Magnet Zone.
ATR measures market volatility.
The zone width is calculated using:
Zone Width = ATR × Zone Width Multiplier
For example, if ATR is 10 and the multiplier is 0.50, the zone extends approximately 5 price units above and below the pivot level.
Benefits:
Adapts zone dimensions to market volatility.
Allows users to customize zone sensitivity.
Provides a consistent volatility-based calculation.
Can be adjusted for different instruments and timeframes.
D. MAGNET STRENGTH SCORE
One of the additional features is the Magnet Strength Score.
The indicator calculates a technical score using two candle characteristics:
Relative Volume
Candle Wick-to-Body Ratio
Relative volume compares the volume of the pivot candle with its 20-period average volume.
The wick-to-body ratio evaluates the size of the relevant rejection wick relative to the candle body.
The two measurements contribute to a normalized score between 1 and 100.
How to interpret the score:
Higher score: Stronger measured volume and/or wick characteristics.
Medium score: Moderate candle characteristics.
Lower score: Weaker measured characteristics.
Important: This is a technical scoring model, not a probability of success, institutional activity measurement, or guaranteed trading outcome.
E. RIGHT-SIDE MAGNET PANEL
The indicator includes a right-side information panel that displays the latest detected Buy and Sell Magnet levels.
It can display:
Latest Buy Magnet level.
Latest Sell Magnet level.
Buy Magnet Strength Score.
Sell Magnet Strength Score.
This makes it easier to monitor the most recently identified reaction areas without repeatedly checking the entire chart.
F. MARKET DIRECTION DASHBOARD
The Market Direction Dashboard provides higher-timeframe trend information.
It uses two Exponential Moving Averages:
EMA 50
EMA 200
The dashboard classifies market direction as:
BULLISH
When higher-timeframe EMA 50 is above EMA 200.
BEARISH
When higher-timeframe EMA 50 is below EMA 200.
NEUTRAL
When neither condition is true.
The dashboard also displays:
Market Trend.
Buy Strength.
Sell Strength.
Current Signal Status.
This feature provides additional directional context rather than predicting future price movements.
G. ZONE FRESHNESS TRACKING
The indicator includes a zone freshness tracking system.
When price first revisits a zone, the zone is marked as TESTED.
Zones that have not yet been revisited remain marked as FRESH.
FRESH ZONE
A detected zone that price has not yet revisited since its creation.
TESTED ZONE
A detected zone that price has revisited at least once.
This feature helps traders distinguish newly identified levels from previously tested areas.
A tested zone is not automatically invalid or weak. Its importance depends on market structure and subsequent price action.
H. MULTI-TIMEFRAME CONFIRMATION
The indicator includes optional higher-timeframe confirmation.
Users can select a separate timeframe for directional analysis.
The confirmation is based on:
Higher-Timeframe EMA 50.
Higher-Timeframe EMA 200.
Bullish Confirmation:
EMA 50 is above EMA 200.
Bearish Confirmation:
EMA 50 is below EMA 200.
When MTF Confirmation is enabled:
Buy signals require bullish higher-timeframe confirmation.
Sell signals require bearish higher-timeframe confirmation.
When disabled, signals can generate without this directional filter.
This helps traders compare lower-timeframe price reactions with the broader trend.
I. BUY AND SELL REJECTION SIGNALS
The indicator identifies potential rejection conditions around the latest Buy and Sell Magnet Zones.
BUY SIGNAL CONDITIONS
A Buy signal requires:
Price interacts with the latest Buy Magnet Zone.
The candle closes above the upper boundary of the zone.
The candle closes bullish.
The selected higher-timeframe direction is bullish, if MTF confirmation is enabled.
The configured signal cooldown condition is satisfied.
SELL SIGNAL CONDITIONS
A Sell signal requires:
Price interacts with the latest Sell Magnet Zone.
The candle closes below the lower boundary of the zone.
The candle closes bearish.
The selected higher-timeframe direction is bearish, if MTF confirmation is enabled.
The configured signal cooldown condition is satisfied.
Signals are based on technical conditions and can produce false signals.
J. SIGNAL COOLDOWN SYSTEM
The indicator includes an adjustable Signal Cooldown setting.
This controls the minimum number of chart bars between consecutive Buy signals and between consecutive Sell signals.
The purpose is to reduce repeated signals during short periods.
It does not guarantee better trading performance or eliminate false signals.
K. GREY REACTION ZONES
Optional grey reaction zones can highlight additional candle-body areas around selected lower-strength pivot highs.
These zones provide extra visual context and are separate from the primary green Buy and purple Sell zones.
Users can disable this feature to maintain a cleaner chart.
L. ALERT SYSTEM
The indicator includes two configurable TradingView alert conditions:
Strong Magnet Buy
Strong Magnet Sell
Users can create alerts through TradingView's alert interface.
Alerts allow traders to monitor when the defined Buy or Sell conditions occur without constantly watching the chart.
3. INPUT SETTINGS EXPLAINED
Magnet Zone Settings
Pivot Strength: 8
Determines how many bars are used on each side to confirm a swing high or swing low.
Higher values generally produce fewer, more selective pivot zones.
Lower values generally produce more frequent pivot zones.
ATR Length: 14
Controls the ATR calculation period.
Zone Width (ATR): 0.50
Controls the size of each Magnet Zone relative to ATR.
Increasing the value creates wider zones.
Decreasing the value creates narrower zones.
Maximum Zones: 8
Controls the maximum number of stored zones.
When the limit is exceeded, the oldest stored zone is removed.
Zone Extension: 30
Controls how far the boxes extend to the right in chart bars.
Premium Features
Show Buy / Sell Signals: Enables or disables signal labels.
Show Zone Labels: Enables or disables zone text.
Right-Side Magnet Panel: Controls the latest Buy and Sell price labels.
Market Dashboard: Controls the dashboard visibility.
Show Strength Score: Controls the strength information in zone labels.
Show Grey Reaction Zones: Enables or disables additional grey zones.
Multi-Timeframe Confirmation
Enable MTF Confirmation
Enables or disables higher-timeframe directional filtering.
Confirmation Timeframe: 240
The default value is 240 minutes (4 hours).
Signal Cooldown Bars: 8
Sets the minimum chart bars between consecutive signals of the same direction.
4. RECOMMENDED CONFIGURATION
For initial testing:
Market: Gold (XAUUSD)
Market: Bitcoin (BTCUSD)
Primary Timeframe: 1H
Higher Timeframe: 4H
Pivot Strength: 8
ATR Length: 14
Zone Width: 0.50
Maximum Zones: 8
Signal Cooldown: 8
These are starting configurations, not universally optimal settings. Different instruments and market conditions may require adjustments.
5. HOW TO USE THE INDICATOR
Step 1 — Identify Market Direction
Check the dashboard to understand the higher-timeframe EMA direction.
Step 2 — Locate Magnet Zones
Observe the green and purple zones to identify potential support and resistance reaction areas.
Step 3 — Evaluate Zone Strength
Review the technical strength estimates to compare the characteristics of recently detected pivot candles.
Step 4 — Check Zone Freshness
Observe whether the zone is Fresh or Tested.
Step 5 — Wait for Price Interaction
Allow price to approach the relevant zone. Avoid treating a zone as an automatic entry signal.
Step 6 — Evaluate Rejection Conditions
Look for the indicator's Buy or Sell rejection signal and consider additional price-action confirmation.
Step 7 — Apply Risk Management
Determine position size, stop-loss placement, and potential reward relative to risk before entering a trade.
6. TECHNICAL DESIGN AND CALCULATION
The indicator combines several independent technical calculations:
Confirmed pivot detection.
ATR-based zone construction.
Relative volume measurement.
Wick-to-body ratio analysis.
Normalized technical strength scoring.
Higher-timeframe EMA comparison.
Zone revisit tracking.
Candle-based rejection conditions.
Signal cooldown logic.
TradingView alert conditions.
The calculations are rule-based and use chart data provided by TradingView.
The indicator does not directly access an exchange's full order book, actual institutional orders, or true market-wide liquidity.
7. IMPORTANT LIMITATIONS
Please read before using the indicator:
Pivot zones require right-side confirmation bars and therefore appear with a delay.
Higher-timeframe EMA values can change while the higher-timeframe candle is still developing.
Strength scores are technical estimates, not verified probabilities.
Volume information depends on the data supplied by the selected TradingView symbol and feed.
A Fresh zone may fail on its first revisit.
A Tested zone may still produce a reaction.
Price can break any support or resistance zone.
Buy and Sell labels are not guaranteed profitable entries.
The indicator is not a substitute for independent analysis or risk management.
8.IMPORTANT NOTE

Please note that all chart annotations, including Liquidity Sweep, CHoCH (Change of Character)Trendline, and BUY labels/arrows, have been added manually for educational and analytical purposes.
These markings are NOT generated by the indicator and are not part of its built-in features.
Strong Magnet Zones PRO [Thomas ] is an advanced technical analysis indicator developed to help traders identify potential market reaction areas, visualize important price zones, evaluate candle-based rejection conditions, and understand higher-timeframe market direction.
The indicator combines confirmed swing highs and swing lows, ATR-based zone calculations, relative volume analysis, wick characteristics, multi-timeframe EMA confirmation, and rejection-based signal conditions into one organized chart tool.
Its main objective is to provide a structured view of potential support and resistance areas without requiring traders to manually draw every important zone.
Instead of focusing on frequent signals, the indicator emphasizes potential reaction areas and additional market context.
It can be used for technical analysis of Gold, BTCUSD, Forex, and other liquid markets.
2. MAIN FEATURES
A. STRONG MAGNET BUY ZONES
The indicator automatically identifies potential bullish reaction areas using confirmed pivot lows.
A pivot low is detected when a candle forms a local swing low according to the selected Pivot Strength setting.
After confirmation, the indicator calculates a zone around that swing low using Average True Range (ATR).
The zone is displayed in green.
What this zone represents:
Potential support or demand reaction area.
A price region where buyers may become active.
An area to monitor for bullish rejection.
A reference for evaluating possible market reactions.
A green zone does not guarantee that price will reverse upward. Price may break through the zone.
B. STRONG MAGNET SELL ZONES
Sell zones are identified using confirmed pivot highs.
When a swing high is confirmed, the indicator calculates an ATR-based price region around that high.
The zone is displayed in purple.
What this zone represents:
Potential resistance or supply reaction area.
A region where selling pressure may appear.
An area to monitor for bearish rejection.
A reference for evaluating possible downside reactions.
A purple zone does not guarantee that price will reverse downward.
C. ATR-BASED ZONE CALCULATION
The indicator uses Average True Range (ATR) to calculate the width of each Magnet Zone.
ATR measures market volatility.
The zone width is calculated using:
Zone Width = ATR × Zone Width Multiplier
For example, if ATR is 10 and the multiplier is 0.50, the zone extends approximately 5 price units above and below the pivot level.
Benefits:
Adapts zone dimensions to market volatility.
Allows users to customize zone sensitivity.
Provides a consistent volatility-based calculation.
Can be adjusted for different instruments and timeframes.
D. MAGNET STRENGTH SCORE
One of the additional features is the Magnet Strength Score.
The indicator calculates a technical score using two candle characteristics:
Relative Volume
Candle Wick-to-Body Ratio
Relative volume compares the volume of the pivot candle with its 20-period average volume.
The wick-to-body ratio evaluates the size of the relevant rejection wick relative to the candle body.
The two measurements contribute to a normalized score between 1 and 100.
How to interpret the score:
Higher score: Stronger measured volume and/or wick characteristics.
Medium score: Moderate candle characteristics.
Lower score: Weaker measured characteristics.
Important: This is a technical scoring model, not a probability of success, institutional activity measurement, or guaranteed trading outcome.
E. RIGHT-SIDE MAGNET PANEL
The indicator includes a right-side information panel that displays the latest detected Buy and Sell Magnet levels.
It can display:
Latest Buy Magnet level.
Latest Sell Magnet level.
Buy Magnet Strength Score.
Sell Magnet Strength Score.
This makes it easier to monitor the most recently identified reaction areas without repeatedly checking the entire chart.
F. MARKET DIRECTION DASHBOARD
The Market Direction Dashboard provides higher-timeframe trend information.
It uses two Exponential Moving Averages:
EMA 50
EMA 200
The dashboard classifies market direction as:
BULLISH
When higher-timeframe EMA 50 is above EMA 200.
BEARISH
When higher-timeframe EMA 50 is below EMA 200.
NEUTRAL
When neither condition is true.
The dashboard also displays:
Market Trend.
Buy Strength.
Sell Strength.
Current Signal Status.
This feature provides additional directional context rather than predicting future price movements.
G. ZONE FRESHNESS TRACKING
The indicator includes a zone freshness tracking system.
When price first revisits a zone, the zone is marked as TESTED.
Zones that have not yet been revisited remain marked as FRESH.
FRESH ZONE
A detected zone that price has not yet revisited since its creation.
TESTED ZONE
A detected zone that price has revisited at least once.
This feature helps traders distinguish newly identified levels from previously tested areas.
A tested zone is not automatically invalid or weak. Its importance depends on market structure and subsequent price action.
H. MULTI-TIMEFRAME CONFIRMATION
The indicator includes optional higher-timeframe confirmation.
Users can select a separate timeframe for directional analysis.
The confirmation is based on:
Higher-Timeframe EMA 50.
Higher-Timeframe EMA 200.
Bullish Confirmation:
EMA 50 is above EMA 200.
Bearish Confirmation:
EMA 50 is below EMA 200.
When MTF Confirmation is enabled:
Buy signals require bullish higher-timeframe confirmation.
Sell signals require bearish higher-timeframe confirmation.
When disabled, signals can generate without this directional filter.
This helps traders compare lower-timeframe price reactions with the broader trend.
I. BUY AND SELL REJECTION SIGNALS
The indicator identifies potential rejection conditions around the latest Buy and Sell Magnet Zones.
BUY SIGNAL CONDITIONS
A Buy signal requires:
Price interacts with the latest Buy Magnet Zone.
The candle closes above the upper boundary of the zone.
The candle closes bullish.
The selected higher-timeframe direction is bullish, if MTF confirmation is enabled.
The configured signal cooldown condition is satisfied.
SELL SIGNAL CONDITIONS
A Sell signal requires:
Price interacts with the latest Sell Magnet Zone.
The candle closes below the lower boundary of the zone.
The candle closes bearish.
The selected higher-timeframe direction is bearish, if MTF confirmation is enabled.
The configured signal cooldown condition is satisfied.
Signals are based on technical conditions and can produce false signals.
J. SIGNAL COOLDOWN SYSTEM
The indicator includes an adjustable Signal Cooldown setting.
This controls the minimum number of chart bars between consecutive Buy signals and between consecutive Sell signals.
The purpose is to reduce repeated signals during short periods.
It does not guarantee better trading performance or eliminate false signals.
K. GREY REACTION ZONES
Optional grey reaction zones can highlight additional candle-body areas around selected lower-strength pivot highs.
These zones provide extra visual context and are separate from the primary green Buy and purple Sell zones.
Users can disable this feature to maintain a cleaner chart.
L. ALERT SYSTEM
The indicator includes two configurable TradingView alert conditions:
Strong Magnet Buy
Strong Magnet Sell
Users can create alerts through TradingView's alert interface.
Alerts allow traders to monitor when the defined Buy or Sell conditions occur without constantly watching the chart.
3. INPUT SETTINGS EXPLAINED
Magnet Zone Settings
Pivot Strength: 8
Determines how many bars are used on each side to confirm a swing high or swing low.
Higher values generally produce fewer, more selective pivot zones.
Lower values generally produce more frequent pivot zones.
ATR Length: 14
Controls the ATR calculation period.
Zone Width (ATR): 0.50
Controls the size of each Magnet Zone relative to ATR.
Increasing the value creates wider zones.
Decreasing the value creates narrower zones.
Maximum Zones: 8
Controls the maximum number of stored zones.
When the limit is exceeded, the oldest stored zone is removed.
Zone Extension: 30
Controls how far the boxes extend to the right in chart bars.
Premium Features
Show Buy / Sell Signals: Enables or disables signal labels.
Show Zone Labels: Enables or disables zone text.
Right-Side Magnet Panel: Controls the latest Buy and Sell price labels.
Market Dashboard: Controls the dashboard visibility.
Show Strength Score: Controls the strength information in zone labels.
Show Grey Reaction Zones: Enables or disables additional grey zones.
Multi-Timeframe Confirmation
Enable MTF Confirmation
Enables or disables higher-timeframe directional filtering.
Confirmation Timeframe: 240
The default value is 240 minutes (4 hours).
Signal Cooldown Bars: 8
Sets the minimum chart bars between consecutive signals of the same direction.
4. RECOMMENDED CONFIGURATION
For initial testing:
Market: Gold (XAUUSD)
Market: Bitcoin (BTCUSD)
Primary Timeframe: 1H
Higher Timeframe: 4H
Pivot Strength: 8
ATR Length: 14
Zone Width: 0.50
Maximum Zones: 8
Signal Cooldown: 8
These are starting configurations, not universally optimal settings. Different instruments and market conditions may require adjustments.
5. HOW TO USE THE INDICATOR
Step 1 — Identify Market Direction
Check the dashboard to understand the higher-timeframe EMA direction.
Step 2 — Locate Magnet Zones
Observe the green and purple zones to identify potential support and resistance reaction areas.
Step 3 — Evaluate Zone Strength
Review the technical strength estimates to compare the characteristics of recently detected pivot candles.
Step 4 — Check Zone Freshness
Observe whether the zone is Fresh or Tested.
Step 5 — Wait for Price Interaction
Allow price to approach the relevant zone. Avoid treating a zone as an automatic entry signal.
Step 6 — Evaluate Rejection Conditions
Look for the indicator's Buy or Sell rejection signal and consider additional price-action confirmation.
Step 7 — Apply Risk Management
Determine position size, stop-loss placement, and potential reward relative to risk before entering a trade.
6. TECHNICAL DESIGN AND CALCULATION
The indicator combines several independent technical calculations:
Confirmed pivot detection.
ATR-based zone construction.
Relative volume measurement.
Wick-to-body ratio analysis.
Normalized technical strength scoring.
Higher-timeframe EMA comparison.
Zone revisit tracking.
Candle-based rejection conditions.
Signal cooldown logic.
TradingView alert conditions.
The calculations are rule-based and use chart data provided by TradingView.
The indicator does not directly access an exchange's full order book, actual institutional orders, or true market-wide liquidity.
7. IMPORTANT LIMITATIONS
Please read before using the indicator:
Pivot zones require right-side confirmation bars and therefore appear with a delay.
Higher-timeframe EMA values can change while the higher-timeframe candle is still developing.
Strength scores are technical estimates, not verified probabilities.
Volume information depends on the data supplied by the selected TradingView symbol and feed.
A Fresh zone may fail on its first revisit.
A Tested zone may still produce a reaction.
Price can break any support or resistance zone.
Buy and Sell labels are not guaranteed profitable entries.
The indicator is not a substitute for independent analysis or risk management.
8.IMPORTANT NOTE
Please note that all chart annotations, including Liquidity Sweep, CHoCH (Change of Character)Trendline, and BUY labels/arrows, have been added manually for educational and analytical purposes.
These markings are NOT generated by the indicator and are not part of its built-in features.

Join telegram for free gold btcusd and usoil signals
t.me/+viyq6E0EBl82MmY8
t.me/+viyq6E0EBl82MmY8
Pernyataan Penyangkalan
Informasi dan publikasi ini tidak dimaksudkan, dan bukan merupakan, saran atau rekomendasi keuangan, investasi, trading, atau jenis lainnya yang diberikan atau didukung oleh TradingView. Baca selengkapnya di Ketentuan Penggunaan.
Join telegram for free gold btcusd and usoil signals
t.me/+viyq6E0EBl82MmY8
t.me/+viyq6E0EBl82MmY8
Pernyataan Penyangkalan
Informasi dan publikasi ini tidak dimaksudkan, dan bukan merupakan, saran atau rekomendasi keuangan, investasi, trading, atau jenis lainnya yang diberikan atau didukung oleh TradingView. Baca selengkapnya di Ketentuan Penggunaan.