ORB Algo PRO GOLD 5 Min [Kami]
ORB Algo PRO [Kami] is an opening range breakout (ORB) indicator for intraday charts (5-minute recommended). It is built on the open-source "ORB Algo" by Flux Charts and keeps its breakout-and-retest entry logic. This version adds several opening ranges at once, symbol-based defaults, fixed ATR targets with a minimum size, TP/SL boxes on every trade and a stricter built-in backtest that includes trading costs.
THE CHART
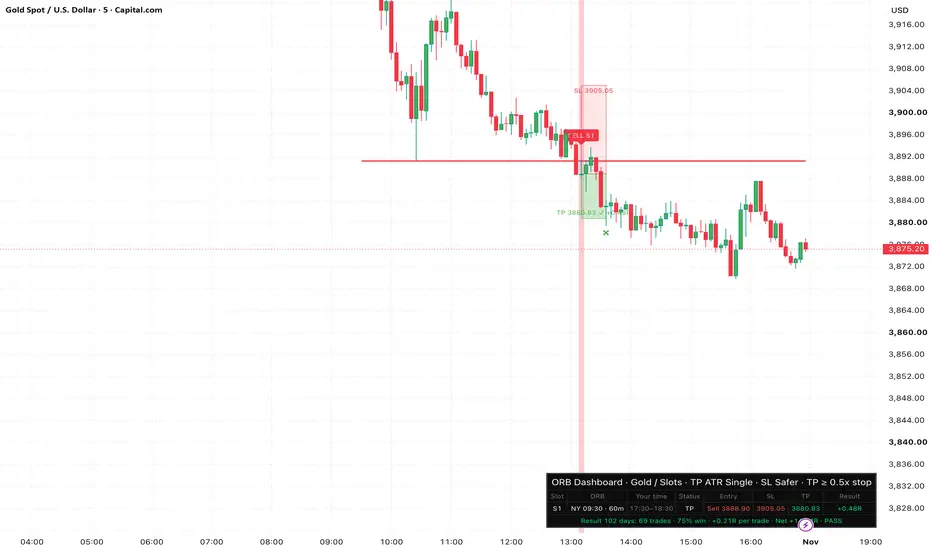
Gold, 5-minute, default gold setup. The lines mark the New York 09:30 opening range (first 60 minutes; green = range high, red = range low). Price closed below the range low, came back to test it and closed below it again, which gives the SELL S1 signal on that candle (highlighted). Red box = stop-loss, green box = take-profit (✓ = hit, trade result in R). The dashboard shows this trade and, on its last line, a summary of all trades on the loaded chart history.
HOW IT WORKS
1. Opening range: the high and low of the first minutes of a session. Session times follow each city's own clock (London, New York, Tokyo), so they stay correct when daylight-saving time changes.
2. Breakout: a candle closes outside the range. If price closes back inside, the breakout is cancelled and the indicator waits for a new one.
3. Retest: price comes back to the broken level and closes beyond it again. Sensitivity sets how many retests are needed (High 0, Medium 1, Low 2, Lowest 3).
4. Signal: BUY or SELL at the close of that candle. All decisions use closed candles only, so signals do not repaint.
5. Stop-loss inside the range: Safer (between the middle and the broken edge), Balanced (middle) or Risky (between the middle and the far edge).
6. Take-profit: one target at 1x ATR(12), but never less than half the stop distance. Other options: 2 targets (part closed at TP1, rest at TP2), 3 ATR targets, or Dynamic (the original Flux EMA exit, taking profit in steps when price closes back across the EMA).
7. One trade per opening range. An open trade is closed when the next range of that session starts, or earlier with the optional time exit.
DEFAULTS (Setup = Auto)
• Gold and other non-crypto symbols: New York 09:30 · 60 min, Safer stop, 1 TP (1x ATR, at least 0.5x the stop).
• Crypto: London 08:00 · 15 min, Balanced stop, Dynamic exit, stop moved to entry after TP1.
Every value is a normal input in the "Gold / Slots" or "BTC settings" group and changes the chart directly. In Gold / Slots up to 4 opening ranges can run together (S1–S4); a custom session (C) can be added in any setup.
WHAT'S NEW COMPARED TO THE ORIGINAL
• Up to 4 opening ranges at once plus a custom session, each with its own length (5 / 15 / 30 / 60 min), daylight-saving safe.
• Symbol-based defaults for gold and crypto, all editable.
• Fixed ATR target with a minimum of half the stop, and a 2-target mode with a partial close.
• TP / SL boxes on every trade (like the position tool) with hit marks and the result in R; live Entry / TP / SL lines with prices.
• Dashboard per session with the range times in your own timezone.
• Rewritten backtest in R with costs, conservative fills, profit factor, drawdown, stress test and a verdict.
• ORB time scanner (7 session times x 4 range lengths).
• alert() messages with prices; optional one trade at a time, time exit, last-entry time and weekend filter.
BACKTEST RULES
Results are in R (1R = distance from entry to the first stop).
• Stop and target are checked from the candle after entry.
• If one candle touches both, the stop is counted first.
• A gap through the stop fills at the open, not at the stop price.
• A round-trip cost is subtracted from every trade (Auto: 0.40 points on non-crypto, 0 on crypto). Set your own broker cost in "Costs".
• Optional results board (Backtesting → Enabled): trades, win %, average R, net R, profit factor and max drawdown per session and in total, plus the average R with an extra cost (stress test).
• Verdict: PASS = at least +0.15R per trade over at least 50 trades; WEAK = positive but below that; FAIL = zero or negative; LOW SAMPLE = fewer than 30 trades.
The test only covers the history loaded on the chart.
ORB TIME SCANNER (optional)
Tests 7 session times x 4 range lengths on the current chart with the same rules and costs, ranked by average R. Use it to see which opening range suits your symbol.
ALERTS
Create an alert on the indicator and choose "Any alert() function call". You get BUY / SELL with entry, SL and TP, then TP, stop-loss and exit messages. Simple alert conditions (Buy / Sell, Take Profit, Stop Loss) are also available.
HOW TO USE
1. Open a 5-minute chart (works up to 15 minutes).
2. Keep Setup on Auto, or choose the group for your market.
3. Set "Your Timezone" in ORB Rules and your broker's cost in Costs.
4. Check the result line (or the results board) on your own symbol before using any setting.
5. Act only on a BUY / SELL label on a closed candle, with the SL and TP shown.
NOTES
The gold defaults were chosen from tests on 5-minute gold data with costs included; other symbols may need other settings. Results depend on the symbol, data feed, costs and period, and past results do not guarantee future results. For education and research only, not financial advice.
CREDITS
Original "ORB Algo" © Flux Charts (fluxchart), Mozilla Public License 2.0. This modified version is published open-source under the same license.
THE CHART
Gold, 5-minute, default gold setup. The lines mark the New York 09:30 opening range (first 60 minutes; green = range high, red = range low). Price closed below the range low, came back to test it and closed below it again, which gives the SELL S1 signal on that candle (highlighted). Red box = stop-loss, green box = take-profit (✓ = hit, trade result in R). The dashboard shows this trade and, on its last line, a summary of all trades on the loaded chart history.
HOW IT WORKS
1. Opening range: the high and low of the first minutes of a session. Session times follow each city's own clock (London, New York, Tokyo), so they stay correct when daylight-saving time changes.
2. Breakout: a candle closes outside the range. If price closes back inside, the breakout is cancelled and the indicator waits for a new one.
3. Retest: price comes back to the broken level and closes beyond it again. Sensitivity sets how many retests are needed (High 0, Medium 1, Low 2, Lowest 3).
4. Signal: BUY or SELL at the close of that candle. All decisions use closed candles only, so signals do not repaint.
5. Stop-loss inside the range: Safer (between the middle and the broken edge), Balanced (middle) or Risky (between the middle and the far edge).
6. Take-profit: one target at 1x ATR(12), but never less than half the stop distance. Other options: 2 targets (part closed at TP1, rest at TP2), 3 ATR targets, or Dynamic (the original Flux EMA exit, taking profit in steps when price closes back across the EMA).
7. One trade per opening range. An open trade is closed when the next range of that session starts, or earlier with the optional time exit.
DEFAULTS (Setup = Auto)
• Gold and other non-crypto symbols: New York 09:30 · 60 min, Safer stop, 1 TP (1x ATR, at least 0.5x the stop).
• Crypto: London 08:00 · 15 min, Balanced stop, Dynamic exit, stop moved to entry after TP1.
Every value is a normal input in the "Gold / Slots" or "BTC settings" group and changes the chart directly. In Gold / Slots up to 4 opening ranges can run together (S1–S4); a custom session (C) can be added in any setup.
WHAT'S NEW COMPARED TO THE ORIGINAL
• Up to 4 opening ranges at once plus a custom session, each with its own length (5 / 15 / 30 / 60 min), daylight-saving safe.
• Symbol-based defaults for gold and crypto, all editable.
• Fixed ATR target with a minimum of half the stop, and a 2-target mode with a partial close.
• TP / SL boxes on every trade (like the position tool) with hit marks and the result in R; live Entry / TP / SL lines with prices.
• Dashboard per session with the range times in your own timezone.
• Rewritten backtest in R with costs, conservative fills, profit factor, drawdown, stress test and a verdict.
• ORB time scanner (7 session times x 4 range lengths).
• alert() messages with prices; optional one trade at a time, time exit, last-entry time and weekend filter.
BACKTEST RULES
Results are in R (1R = distance from entry to the first stop).
• Stop and target are checked from the candle after entry.
• If one candle touches both, the stop is counted first.
• A gap through the stop fills at the open, not at the stop price.
• A round-trip cost is subtracted from every trade (Auto: 0.40 points on non-crypto, 0 on crypto). Set your own broker cost in "Costs".
• Optional results board (Backtesting → Enabled): trades, win %, average R, net R, profit factor and max drawdown per session and in total, plus the average R with an extra cost (stress test).
• Verdict: PASS = at least +0.15R per trade over at least 50 trades; WEAK = positive but below that; FAIL = zero or negative; LOW SAMPLE = fewer than 30 trades.
The test only covers the history loaded on the chart.
ORB TIME SCANNER (optional)
Tests 7 session times x 4 range lengths on the current chart with the same rules and costs, ranked by average R. Use it to see which opening range suits your symbol.
ALERTS
Create an alert on the indicator and choose "Any alert() function call". You get BUY / SELL with entry, SL and TP, then TP, stop-loss and exit messages. Simple alert conditions (Buy / Sell, Take Profit, Stop Loss) are also available.
HOW TO USE
1. Open a 5-minute chart (works up to 15 minutes).
2. Keep Setup on Auto, or choose the group for your market.
3. Set "Your Timezone" in ORB Rules and your broker's cost in Costs.
4. Check the result line (or the results board) on your own symbol before using any setting.
5. Act only on a BUY / SELL label on a closed candle, with the SL and TP shown.
NOTES
The gold defaults were chosen from tests on 5-minute gold data with costs included; other symbols may need other settings. Results depend on the symbol, data feed, costs and period, and past results do not guarantee future results. For education and research only, not financial advice.
CREDITS
Original "ORB Algo" © Flux Charts (fluxchart), Mozilla Public License 2.0. This modified version is published open-source under the same license.

Pernyataan Penyangkalan
Informasi dan publikasi ini tidak dimaksudkan, dan bukan merupakan, saran atau rekomendasi keuangan, investasi, trading, atau jenis lainnya yang diberikan atau didukung oleh TradingView. Baca selengkapnya di Ketentuan Penggunaan.
Pernyataan Penyangkalan
Informasi dan publikasi ini tidak dimaksudkan, dan bukan merupakan, saran atau rekomendasi keuangan, investasi, trading, atau jenis lainnya yang diberikan atau didukung oleh TradingView. Baca selengkapnya di Ketentuan Penggunaan.