OPEN-SOURCE SCRIPT
RSI Signals Entries
RSI Signals Entries — Publish Description
What This Indicator Is
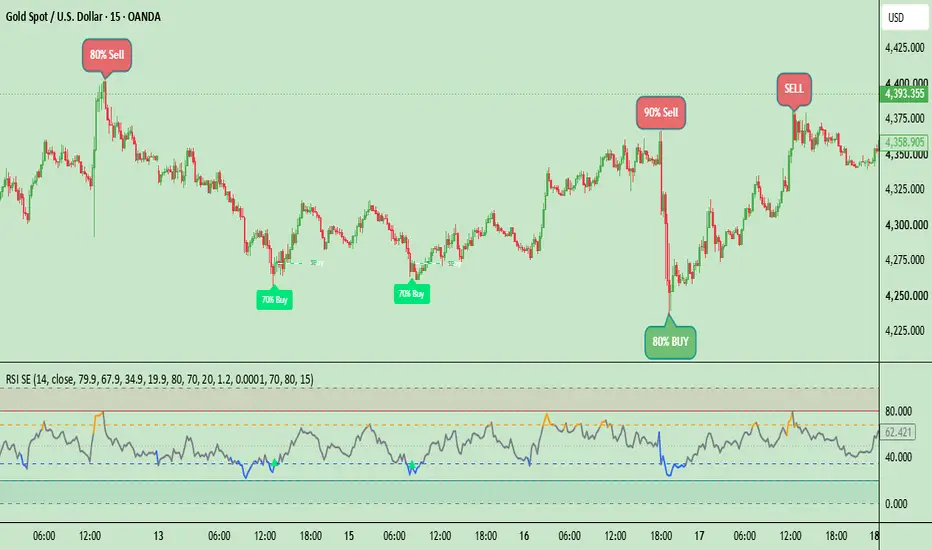
RSI Signals Entries is a four-level Relative Strength Index (RSI) tool built to turn the classic overbought/oversold RSI reading into a clear, actionable signal system. Instead of a plain single-line RSI, it plots a colour-coded RSI with four defined levels — Over Buy, Resistance, Support, and Over Sold — and automatically marks potential Sell and Buy opportunities both on the RSI pane itself and directly on the price candles, together with a fixed confidence "Strength %" label for every signal.
Why It Was Built
Reading raw RSI values and deciding when a reading is "extreme enough" to act on is subjective and inconsistent from one trader to another. This script removes that guesswork by defining four fixed levels up front and applying two distinct, repeatable rules on top of them: a pure RSI-extreme rule for the strongest, highest-confidence reversals, and a level-plus-candle-confirmation rule for slightly less extreme readings that still show real rejection at a key zone. Every signal is labelled with the same fixed strength value every time it appears, so the trader always knows which of the two rules produced it.
How It Works
The four RSI levels
Over Buy: 79.90
Resistance: 67.90
Support: 34.90
Over Sold: 19.90
The RSI line itself changes colour depending on which zone it is currently in (Over Buy, Resistance, neutral, Support, or Over Sold), so the current market condition is visible at a glance without reading the exact number.
The strong-candle filter
A candle only counts as "strong" when its body (the distance between open and close, not counting wicks) is at least a chosen multiple of the average candle body size over a recent lookback period. This stops the indicator from reacting to small, indecisive candles.
The two signal rules
Extreme rule (Over Buy / Over Sold): whenever RSI reaches the Over Buy or Over Sold level, a signal fires immediately with a fixed Strength of 80%. No candle confirmation is required, because the RSI reading itself is already at its most extreme.
Zone-confirmation rule (Resistance / Support): whenever RSI is sitting inside the Resistance zone (between Resistance and Over Buy) or the Support zone (between Over Sold and Support) and a strong candle closes in the reversal direction, a signal fires with a fixed Strength of 70%. This rule needs the extra candle confirmation because the RSI reading on its own is not yet at a true extreme.
Every signal is plotted twice: once on the RSI pane at the exact RSI value where it fired, and once on the price chart directly above or below the triggering candle, so the same event can be read from either view. Each chart-side signal also draws an Entry line, a Stop-Loss line, and a Take-Profit line at a configurable pip distance, so the trade plan is visible the moment the signal appears.
Step-by-Step: How to Take Each Entry
1. Over Buy entry (Sell, 80% strength)
Watch the RSI line rise into the Over Buy zone (79.90 and above).
The moment RSI reaches this level, a red downward triangle appears both on the RSI pane and above the corresponding candle on the price chart, labelled "80% Sell".
Enter a Sell position at or near the close of that candle.
Use the auto-plotted Entry / Stop-Loss / Take-Profit lines as your reference levels, or set your own stop just above the recent swing high and your target using your own risk-reward preference.
2. Resistance entry (Sell, 70% strength)
Watch the RSI line move up into the Resistance zone (between 67.90 and 79.90), without yet reaching Over Buy.
Wait for a strong bearish candle to close while RSI is still inside this zone — this is the rejection confirmation the rule requires.
Once that candle closes, a red downward triangle appears on both the RSI pane and the price chart, labelled "70% Sell".
Enter a Sell position at or near the close of that confirming candle, using the plotted Entry / Stop-Loss / Take-Profit lines as your reference.
3. Over Sold entry (Buy, 80% strength)
Watch the RSI line fall into the Over Sold zone (19.90 and below).
The moment RSI reaches this level, a green upward triangle appears both on the RSI pane and below the corresponding candle on the price chart, labelled "80% Buy".
Enter a Buy position at or near the close of that candle, using the plotted Entry / Stop-Loss / Take-Profit lines as your reference.
4. Support entry (Buy, 70% strength)
Watch the RSI line move down into the Support zone (between 19.90 and 34.90), without yet reaching Over Sold.
Wait for a strong bullish candle to close while RSI is still inside this zone — this is the rejection confirmation the rule requires.
Once that candle closes, a green upward triangle appears on both the RSI pane and the price chart, labelled "70% Buy".
Enter a Buy position at or near the close of that confirming candle, using the plotted Entry / Stop-Loss / Take-Profit lines as your reference.
Settings Worth Knowing Before Use
All four RSI levels, the RSI length and source, the strong-candle lookback and multiplier, the two fixed strength percentages, the pip size, and the Stop-Loss/Take-Profit pip distances are all adjustable from the indicator's settings panel to suit different instruments and trading styles.
The indicator calculates on any timeframe, but the default settings are tuned for fast, short-term signals on 1-minute and 5-minute charts. On higher timeframes, the pip-based Stop-Loss/Take-Profit distances should be widened accordingly.
"Wait for Candle Close" is enabled by default so that every signal shown is fully confirmed and will not repaint; disabling it produces faster but less reliable real-time signals.
Disclaimer
This indicator is a technical analysis tool and does not constitute financial advice. The Strength % values are fixed confidence labels describing which internal rule produced a given signal, not a statistical win-rate or a guarantee of outcome. All trading involves risk, and past performance of any signal or pattern does not guarantee future results. Always use proper risk management and combine this tool with your own analysis before entering any trade.
Original Script Declaration
Script Name: RSI Signals Entries
Author: Michael_Fx_Trader
Publisher: Michael_Fx_Trader
Rights: © Michael_Fx_Trader. All rights reserved.
Originality Statement: This is an original work, designed and coded from scratch by Michael_Fx_Trader. The 4-level colored RSI zone engine, the zone-entry armed/fired signal state machine, the fixed-confidence Strength % labeling system, the dual chart + RSI-pane signal display, and the pip-based Entry / Stop-Loss / Take-Profit level drawing engine were all independently conceived and implemented for this publication. No proprietary source code, private scripts, or copyrighted material belonging to any other author has been copied, mashed-up, or reused in any part of this script.
Author Verification / Declaration: I, Michael_Fx_Trader, am the sole author and publisher of this script. I hold full authorship rights over its source code, its underlying logic, and its visual presentation. The Relative Strength Index (RSI) itself is a well-known, generic public-domain technical indicator (J. Welles Wilder) and is not owned by any individual author; only the zone/signal/labeling logic built around it here is original to this script.
What This Indicator Is
RSI Signals Entries is a four-level Relative Strength Index (RSI) tool built to turn the classic overbought/oversold RSI reading into a clear, actionable signal system. Instead of a plain single-line RSI, it plots a colour-coded RSI with four defined levels — Over Buy, Resistance, Support, and Over Sold — and automatically marks potential Sell and Buy opportunities both on the RSI pane itself and directly on the price candles, together with a fixed confidence "Strength %" label for every signal.
Why It Was Built
Reading raw RSI values and deciding when a reading is "extreme enough" to act on is subjective and inconsistent from one trader to another. This script removes that guesswork by defining four fixed levels up front and applying two distinct, repeatable rules on top of them: a pure RSI-extreme rule for the strongest, highest-confidence reversals, and a level-plus-candle-confirmation rule for slightly less extreme readings that still show real rejection at a key zone. Every signal is labelled with the same fixed strength value every time it appears, so the trader always knows which of the two rules produced it.
How It Works
The four RSI levels
Over Buy: 79.90
Resistance: 67.90
Support: 34.90
Over Sold: 19.90
The RSI line itself changes colour depending on which zone it is currently in (Over Buy, Resistance, neutral, Support, or Over Sold), so the current market condition is visible at a glance without reading the exact number.
The strong-candle filter
A candle only counts as "strong" when its body (the distance between open and close, not counting wicks) is at least a chosen multiple of the average candle body size over a recent lookback period. This stops the indicator from reacting to small, indecisive candles.
The two signal rules
Extreme rule (Over Buy / Over Sold): whenever RSI reaches the Over Buy or Over Sold level, a signal fires immediately with a fixed Strength of 80%. No candle confirmation is required, because the RSI reading itself is already at its most extreme.
Zone-confirmation rule (Resistance / Support): whenever RSI is sitting inside the Resistance zone (between Resistance and Over Buy) or the Support zone (between Over Sold and Support) and a strong candle closes in the reversal direction, a signal fires with a fixed Strength of 70%. This rule needs the extra candle confirmation because the RSI reading on its own is not yet at a true extreme.
Every signal is plotted twice: once on the RSI pane at the exact RSI value where it fired, and once on the price chart directly above or below the triggering candle, so the same event can be read from either view. Each chart-side signal also draws an Entry line, a Stop-Loss line, and a Take-Profit line at a configurable pip distance, so the trade plan is visible the moment the signal appears.
Step-by-Step: How to Take Each Entry
1. Over Buy entry (Sell, 80% strength)
Watch the RSI line rise into the Over Buy zone (79.90 and above).
The moment RSI reaches this level, a red downward triangle appears both on the RSI pane and above the corresponding candle on the price chart, labelled "80% Sell".
Enter a Sell position at or near the close of that candle.
Use the auto-plotted Entry / Stop-Loss / Take-Profit lines as your reference levels, or set your own stop just above the recent swing high and your target using your own risk-reward preference.
2. Resistance entry (Sell, 70% strength)
Watch the RSI line move up into the Resistance zone (between 67.90 and 79.90), without yet reaching Over Buy.
Wait for a strong bearish candle to close while RSI is still inside this zone — this is the rejection confirmation the rule requires.
Once that candle closes, a red downward triangle appears on both the RSI pane and the price chart, labelled "70% Sell".
Enter a Sell position at or near the close of that confirming candle, using the plotted Entry / Stop-Loss / Take-Profit lines as your reference.
3. Over Sold entry (Buy, 80% strength)
Watch the RSI line fall into the Over Sold zone (19.90 and below).
The moment RSI reaches this level, a green upward triangle appears both on the RSI pane and below the corresponding candle on the price chart, labelled "80% Buy".
Enter a Buy position at or near the close of that candle, using the plotted Entry / Stop-Loss / Take-Profit lines as your reference.
4. Support entry (Buy, 70% strength)
Watch the RSI line move down into the Support zone (between 19.90 and 34.90), without yet reaching Over Sold.
Wait for a strong bullish candle to close while RSI is still inside this zone — this is the rejection confirmation the rule requires.
Once that candle closes, a green upward triangle appears on both the RSI pane and the price chart, labelled "70% Buy".
Enter a Buy position at or near the close of that confirming candle, using the plotted Entry / Stop-Loss / Take-Profit lines as your reference.
Settings Worth Knowing Before Use
All four RSI levels, the RSI length and source, the strong-candle lookback and multiplier, the two fixed strength percentages, the pip size, and the Stop-Loss/Take-Profit pip distances are all adjustable from the indicator's settings panel to suit different instruments and trading styles.
The indicator calculates on any timeframe, but the default settings are tuned for fast, short-term signals on 1-minute and 5-minute charts. On higher timeframes, the pip-based Stop-Loss/Take-Profit distances should be widened accordingly.
"Wait for Candle Close" is enabled by default so that every signal shown is fully confirmed and will not repaint; disabling it produces faster but less reliable real-time signals.
Disclaimer
This indicator is a technical analysis tool and does not constitute financial advice. The Strength % values are fixed confidence labels describing which internal rule produced a given signal, not a statistical win-rate or a guarantee of outcome. All trading involves risk, and past performance of any signal or pattern does not guarantee future results. Always use proper risk management and combine this tool with your own analysis before entering any trade.
Original Script Declaration
Script Name: RSI Signals Entries
Author: Michael_Fx_Trader
Publisher: Michael_Fx_Trader
Rights: © Michael_Fx_Trader. All rights reserved.
Originality Statement: This is an original work, designed and coded from scratch by Michael_Fx_Trader. The 4-level colored RSI zone engine, the zone-entry armed/fired signal state machine, the fixed-confidence Strength % labeling system, the dual chart + RSI-pane signal display, and the pip-based Entry / Stop-Loss / Take-Profit level drawing engine were all independently conceived and implemented for this publication. No proprietary source code, private scripts, or copyrighted material belonging to any other author has been copied, mashed-up, or reused in any part of this script.
Author Verification / Declaration: I, Michael_Fx_Trader, am the sole author and publisher of this script. I hold full authorship rights over its source code, its underlying logic, and its visual presentation. The Relative Strength Index (RSI) itself is a well-known, generic public-domain technical indicator (J. Welles Wilder) and is not owned by any individual author; only the zone/signal/labeling logic built around it here is original to this script.
Skrip open-source
Dengan semangat TradingView yang sesungguhnya, pembuat skrip ini telah menjadikannya sebagai sumber terbuka, sehingga para trader dapat meninjau dan memverifikasi fungsinya. Salut untuk penulisnya! Meskipun Anda dapat menggunakannya secara gratis, perlu diingat bahwa penerbitan ulang kode ini tunduk pada Tata Tertib kami.

Join My VIP Free Signals Channel.✅
t.me/+kECBnKkROv9jODZl
t.me/+kECBnKkROv9jODZl
For Daily LIVE Trades,
Join Free Telegram Channel ✅
t.me/+kECBnKkROv9jODZl
t.me/+kECBnKkROv9jODZl
t.me/+kECBnKkROv9jODZl
t.me/+kECBnKkROv9jODZl
For Daily LIVE Trades,
Join Free Telegram Channel ✅
t.me/+kECBnKkROv9jODZl
t.me/+kECBnKkROv9jODZl
Pernyataan Penyangkalan
Informasi dan publikasi ini tidak dimaksudkan, dan bukan merupakan, saran atau rekomendasi keuangan, investasi, trading, atau jenis lainnya yang diberikan atau didukung oleh TradingView. Baca selengkapnya di Ketentuan Penggunaan.
Skrip open-source
Dengan semangat TradingView yang sesungguhnya, pembuat skrip ini telah menjadikannya sebagai sumber terbuka, sehingga para trader dapat meninjau dan memverifikasi fungsinya. Salut untuk penulisnya! Meskipun Anda dapat menggunakannya secara gratis, perlu diingat bahwa penerbitan ulang kode ini tunduk pada Tata Tertib kami.
Join My VIP Free Signals Channel.✅
t.me/+kECBnKkROv9jODZl
t.me/+kECBnKkROv9jODZl
For Daily LIVE Trades,
Join Free Telegram Channel ✅
t.me/+kECBnKkROv9jODZl
t.me/+kECBnKkROv9jODZl
t.me/+kECBnKkROv9jODZl
t.me/+kECBnKkROv9jODZl
For Daily LIVE Trades,
Join Free Telegram Channel ✅
t.me/+kECBnKkROv9jODZl
t.me/+kECBnKkROv9jODZl
Pernyataan Penyangkalan
Informasi dan publikasi ini tidak dimaksudkan, dan bukan merupakan, saran atau rekomendasi keuangan, investasi, trading, atau jenis lainnya yang diberikan atau didukung oleh TradingView. Baca selengkapnya di Ketentuan Penggunaan.