OPEN-SOURCE SCRIPT
Diupdate Kalman Flow Market Screener [NICK789]
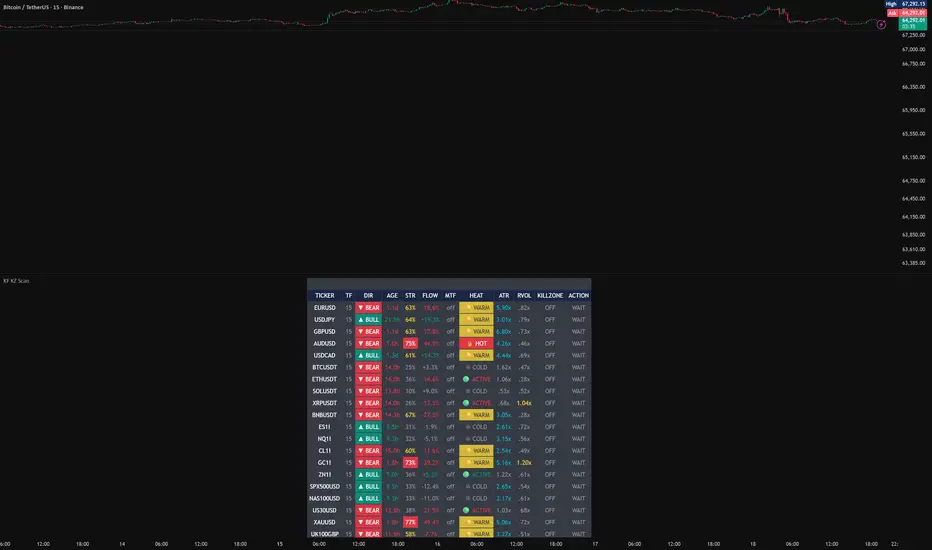
Kalman Flow Market Screener [NICK789]
Kalman Flow Market Screener is a multi-symbol dashboard built around a Kalman-based adaptive trail engine. It scans up to 20 user-selected tickers and displays BULL/BEAR trend state, fresh flips, flip-risk warnings, trend strength, volume flow, relative volume, session timing, higher-timeframe alignment, and possible trade-ready conditions.
This script is designed as a market scanner and decision-support tool. Its purpose is to reduce chart-hopping and help traders quickly identify which symbols may deserve attention.
It is not intended to be a standalone buy/sell system. Entries, exits, stop losses, take profits, and position sizing should still be handled by the trader’s own trading plan.
Core concept
The screener is built around a Kalman Flow Trail engine that combines:
* Fast and slow Kalman filtering
* Market structure impulse
* Adaptive smoothing
* ATR-based trail boundaries
* BULL/BEAR trail direction
* Flip-risk proximity logic
* Volume-flow strength scoring
* Relative volume filtering
* Session-based trade window scoring
* Optional higher-timeframe alignment
How the Kalman Flow engine works
The script first calculates a fast and slow Kalman estimate of price.
The fast Kalman reacts more quickly to price movement, while the slow Kalman acts as a smoother confirmation reference.
The engine also tracks small market-structure breaks using pivot-based structure logic. When price breaks above a recent structure high, it creates a bullish structure impulse. When price breaks below a recent structure low, it creates a bearish structure impulse.
These structure impulses are smoothed into a structure bias and structure activity reading.
The Kalman trail then adapts using:
* Kalman direction
* Kalman agreement between fast and slow estimates
* Structure bias
* Structure activity
* ATR-based movement
* Adaptive smoothing
The result is a dynamic Kalman flow line that responds more when structure is active and stays smoother when the market is quieter.
ATR boundaries are built around the Kalman flow basis. A BULL state is confirmed when price breaks above the upper flow boundary. A BEAR state is confirmed when price breaks below the lower flow boundary.
Once a BULL or BEAR state is established, the trail follows on the opposite side of price. This creates a directional trail similar in purpose to a trend-following stop, but driven by Kalman smoothing, structure bias, and ATR boundaries.
What makes this screener different
This screener is not only checking whether price is above or below a moving average.
It combines Kalman filtering, structure movement, ATR trail logic, flow strength, relative volume, timing conditions, and optional higher-timeframe agreement into one table.
The goal is to answer a practical scanning question:
Which markets are trending, which markets recently flipped, and which markets are worth checking now?
What the table shows
TICKER
The selected symbol being scanned.
TF
The timeframe being scanned.
DIR
The current confirmed BULL or BEAR Kalman Flow direction.
AGE
How long ago the most recent confirmed flip occurred.
STR
Trend strength score based on ATR distance and supportive flow.
FLOW
Estimated volume-flow delta during the active trend.
MTF
Optional higher-timeframe agreement status.
HEAT
Quick trend state label such as Fresh, Hot, Warm, Active, Cold, or Flip Risk.
ATR
Distance between price and the Kalman trail in ATR units.
RVOL
Current volume compared to its volume baseline.
WINDOW
Session and volume-based timing score.
ACTION
Simplified status such as Wait, Watch, BULL Setup, BEAR Setup, Low Vol, Bad Time, Extended, or RSI Hot.
How the filters work together
Trend direction
The Kalman Flow Trail defines whether each symbol is currently in a BULL or BEAR state.
Fresh flip detection
The screener highlights symbols that recently changed from BEAR to BULL or from BULL to BEAR.
Flip-risk warning
The script can warn when price is pressing close to the opposite flow boundary before a confirmed flip. This is a caution state, not a confirmed signal.
Trend age
The script tracks how old the current trend is. This helps separate fresh movement from older, more mature trends.
Trend delta flow
The script estimates buy/sell pressure using candle direction and volume. Up candles contribute to buy volume, down candles contribute to sell volume, and neutral candles are split. This creates a simple volume-flow reading for the current trend.
Trend strength
The strength score combines ATR distance from the Kalman trail with whether volume flow supports the active direction. Stronger movement with supportive flow receives a higher score.
Relative volume
RVOL compares current volume to its moving average baseline. This helps identify whether the current move is happening with above-normal or quiet activity.
Trade window score
The trade window score combines London/New York session timing with relative volume. More active periods and stronger RVOL receive higher scores, while quieter periods receive lower scores.
Higher-timeframe filter
The optional higher-timeframe filter allows traders to focus only on symbols where the selected higher timeframe agrees with the current BULL/BEAR direction.
Action status
The action column combines fresh flip status, RVOL, ATR distance, RSI condition, trade window score, and warning state into one simple readout.
Display modes
All 20 Trend States
* Shows selected tickers and their current Kalman Flow state.
* Useful for general market monitoring.
* Best when traders want a full watchlist overview.
Fresh Signals Only
* Shows only recent flips and optional flip-risk warnings.
* Useful when traders only want to see symbols that may need attention now.
* Helps reduce table noise.
Timeframe behaviour
For best accuracy, use a chart timeframe equal to or lower than the selected screener timeframe.
Examples:
* A 15-minute screener works best on a 15-minute chart or lower.
* A 1-hour screener works best on a 1-hour chart or lower.
* A daily screener can be viewed from intraday charts.
If the chart timeframe is higher than the selected screener timeframe, the script displays a timeframe warning and uses the chart timeframe as a fallback.
This fallback is included to avoid misleading lower-timeframe data when Pine cannot fully process every lower-timeframe bar from a higher-timeframe chart.
Alerts
The script includes TradingView alert conditions for:
* BULL flip
* BEAR flip
* Any confirmed flip
* BULL trade-ready setup
* BEAR trade-ready setup
* Any trade-ready setup
* BULL flip-risk warning
* BEAR flip-risk warning
* Any flip-risk warning
* Master alert
For dynamic ticker messages, create an alert using TradingView’s “Any alert() function call” option. This allows the alert message to include the symbols that triggered during the confirmed bar.
Suggested workflow
1. Choose the screener timeframe.
2. Select up to 20 symbols.
3. Choose All 20 Trend States or Fresh Signals Only.
4. Check the ACTION column for BULL Setup, BEAR Setup, Watch, or Wait.
5. Review RVOL and WINDOW to see whether the market is active.
6. Review FLOW and STR to check whether the move has supportive pressure.
7. Use MTF alignment if higher-timeframe filtering is enabled.
8. Open the individual chart before making any trade decision.
9. Apply your own entry, stop loss, take profit, and risk management rules.
Important notes
* BULL and BEAR flips are confirmed Kalman Flow direction changes.
* Flip-risk warnings are early caution states, not confirmed entries.
* The action column is a decision-support label, not financial advice.
* RVOL and window scoring measure activity and timing conditions, not future direction.
* Higher-timeframe filtering can reduce signals and may filter out early moves.
* This script is designed for scanning and filtering, not guaranteed trade execution.
Disclaimer
This indicator is for educational and informational purposes only. It is not financial advice. Traders should test the script on their own markets and timeframes, use proper risk management, and make independent trading decisions.
Kalman Flow Market Screener is a multi-symbol dashboard built around a Kalman-based adaptive trail engine. It scans up to 20 user-selected tickers and displays BULL/BEAR trend state, fresh flips, flip-risk warnings, trend strength, volume flow, relative volume, session timing, higher-timeframe alignment, and possible trade-ready conditions.
This script is designed as a market scanner and decision-support tool. Its purpose is to reduce chart-hopping and help traders quickly identify which symbols may deserve attention.
It is not intended to be a standalone buy/sell system. Entries, exits, stop losses, take profits, and position sizing should still be handled by the trader’s own trading plan.
Core concept
The screener is built around a Kalman Flow Trail engine that combines:
* Fast and slow Kalman filtering
* Market structure impulse
* Adaptive smoothing
* ATR-based trail boundaries
* BULL/BEAR trail direction
* Flip-risk proximity logic
* Volume-flow strength scoring
* Relative volume filtering
* Session-based trade window scoring
* Optional higher-timeframe alignment
How the Kalman Flow engine works
The script first calculates a fast and slow Kalman estimate of price.
The fast Kalman reacts more quickly to price movement, while the slow Kalman acts as a smoother confirmation reference.
The engine also tracks small market-structure breaks using pivot-based structure logic. When price breaks above a recent structure high, it creates a bullish structure impulse. When price breaks below a recent structure low, it creates a bearish structure impulse.
These structure impulses are smoothed into a structure bias and structure activity reading.
The Kalman trail then adapts using:
* Kalman direction
* Kalman agreement between fast and slow estimates
* Structure bias
* Structure activity
* ATR-based movement
* Adaptive smoothing
The result is a dynamic Kalman flow line that responds more when structure is active and stays smoother when the market is quieter.
ATR boundaries are built around the Kalman flow basis. A BULL state is confirmed when price breaks above the upper flow boundary. A BEAR state is confirmed when price breaks below the lower flow boundary.
Once a BULL or BEAR state is established, the trail follows on the opposite side of price. This creates a directional trail similar in purpose to a trend-following stop, but driven by Kalman smoothing, structure bias, and ATR boundaries.
What makes this screener different
This screener is not only checking whether price is above or below a moving average.
It combines Kalman filtering, structure movement, ATR trail logic, flow strength, relative volume, timing conditions, and optional higher-timeframe agreement into one table.
The goal is to answer a practical scanning question:
Which markets are trending, which markets recently flipped, and which markets are worth checking now?
What the table shows
TICKER
The selected symbol being scanned.
TF
The timeframe being scanned.
DIR
The current confirmed BULL or BEAR Kalman Flow direction.
AGE
How long ago the most recent confirmed flip occurred.
STR
Trend strength score based on ATR distance and supportive flow.
FLOW
Estimated volume-flow delta during the active trend.
MTF
Optional higher-timeframe agreement status.
HEAT
Quick trend state label such as Fresh, Hot, Warm, Active, Cold, or Flip Risk.
ATR
Distance between price and the Kalman trail in ATR units.
RVOL
Current volume compared to its volume baseline.
WINDOW
Session and volume-based timing score.
ACTION
Simplified status such as Wait, Watch, BULL Setup, BEAR Setup, Low Vol, Bad Time, Extended, or RSI Hot.
How the filters work together
Trend direction
The Kalman Flow Trail defines whether each symbol is currently in a BULL or BEAR state.
Fresh flip detection
The screener highlights symbols that recently changed from BEAR to BULL or from BULL to BEAR.
Flip-risk warning
The script can warn when price is pressing close to the opposite flow boundary before a confirmed flip. This is a caution state, not a confirmed signal.
Trend age
The script tracks how old the current trend is. This helps separate fresh movement from older, more mature trends.
Trend delta flow
The script estimates buy/sell pressure using candle direction and volume. Up candles contribute to buy volume, down candles contribute to sell volume, and neutral candles are split. This creates a simple volume-flow reading for the current trend.
Trend strength
The strength score combines ATR distance from the Kalman trail with whether volume flow supports the active direction. Stronger movement with supportive flow receives a higher score.
Relative volume
RVOL compares current volume to its moving average baseline. This helps identify whether the current move is happening with above-normal or quiet activity.
Trade window score
The trade window score combines London/New York session timing with relative volume. More active periods and stronger RVOL receive higher scores, while quieter periods receive lower scores.
Higher-timeframe filter
The optional higher-timeframe filter allows traders to focus only on symbols where the selected higher timeframe agrees with the current BULL/BEAR direction.
Action status
The action column combines fresh flip status, RVOL, ATR distance, RSI condition, trade window score, and warning state into one simple readout.
Display modes
All 20 Trend States
* Shows selected tickers and their current Kalman Flow state.
* Useful for general market monitoring.
* Best when traders want a full watchlist overview.
Fresh Signals Only
* Shows only recent flips and optional flip-risk warnings.
* Useful when traders only want to see symbols that may need attention now.
* Helps reduce table noise.
Timeframe behaviour
For best accuracy, use a chart timeframe equal to or lower than the selected screener timeframe.
Examples:
* A 15-minute screener works best on a 15-minute chart or lower.
* A 1-hour screener works best on a 1-hour chart or lower.
* A daily screener can be viewed from intraday charts.
If the chart timeframe is higher than the selected screener timeframe, the script displays a timeframe warning and uses the chart timeframe as a fallback.
This fallback is included to avoid misleading lower-timeframe data when Pine cannot fully process every lower-timeframe bar from a higher-timeframe chart.
Alerts
The script includes TradingView alert conditions for:
* BULL flip
* BEAR flip
* Any confirmed flip
* BULL trade-ready setup
* BEAR trade-ready setup
* Any trade-ready setup
* BULL flip-risk warning
* BEAR flip-risk warning
* Any flip-risk warning
* Master alert
For dynamic ticker messages, create an alert using TradingView’s “Any alert() function call” option. This allows the alert message to include the symbols that triggered during the confirmed bar.
Suggested workflow
1. Choose the screener timeframe.
2. Select up to 20 symbols.
3. Choose All 20 Trend States or Fresh Signals Only.
4. Check the ACTION column for BULL Setup, BEAR Setup, Watch, or Wait.
5. Review RVOL and WINDOW to see whether the market is active.
6. Review FLOW and STR to check whether the move has supportive pressure.
7. Use MTF alignment if higher-timeframe filtering is enabled.
8. Open the individual chart before making any trade decision.
9. Apply your own entry, stop loss, take profit, and risk management rules.
Important notes
* BULL and BEAR flips are confirmed Kalman Flow direction changes.
* Flip-risk warnings are early caution states, not confirmed entries.
* The action column is a decision-support label, not financial advice.
* RVOL and window scoring measure activity and timing conditions, not future direction.
* Higher-timeframe filtering can reduce signals and may filter out early moves.
* This script is designed for scanning and filtering, not guaranteed trade execution.
Disclaimer
This indicator is for educational and informational purposes only. It is not financial advice. Traders should test the script on their own markets and timeframes, use proper risk management, and make independent trading decisions.
Catatan Rilis
updated Window to killzoneCatatan Rilis
bug fixCatatan Rilis
**Update Notes**This update improves signal confirmation and live signal tracking for the Kalman Flow Killzone Screener.
**What’s New**
* Added a new **TRACK** column beside ACTION.
* TRACK shows whether price is currently moving **with** or **against** the confirmed signal direction.
* Added simple directional status:
* **FOLLOW** = price is moving in the signal direction.
* **AGAINST** = price is moving against the signal.
* **FLAT** = movement is too small to count.
* **WAIT** = signal pressure is present, but candle confirmation has not completed yet.
**Signal Confirmation Improvement**
* Signals now wait for the screener candle to confirm before becoming active.
* This helps reduce early signal flashing before candle close.
* ACTION can now show a wait state when price is trying to flip but the signal is not confirmed yet.
**Why This Matters**
This makes the screener easier to read at a glance. After a BULL or BEAR signal fires, the TRACK column quickly shows whether price is respecting that signal direction or moving against it.
**Reminder**
This tool is designed as a market scanner and signal-tracking dashboard. It does not guarantee trade outcomes and should be used with proper risk management and confirmation from your own trading plan.
Catatan Rilis
bug fixCatatan Rilis
.Skrip open-source
Dengan semangat TradingView yang sesungguhnya, pembuat skrip ini telah menjadikannya sebagai sumber terbuka, sehingga para trader dapat meninjau dan memverifikasi fungsinya. Salut untuk penulisnya! Meskipun Anda dapat menggunakannya secara gratis, perlu diingat bahwa penerbitan ulang kode ini tunduk pada Tata Tertib kami.

Pernyataan Penyangkalan
Informasi dan publikasi ini tidak dimaksudkan, dan bukan merupakan, saran atau rekomendasi keuangan, investasi, trading, atau jenis lainnya yang diberikan atau didukung oleh TradingView. Baca selengkapnya di Ketentuan Penggunaan.
Skrip open-source
Dengan semangat TradingView yang sesungguhnya, pembuat skrip ini telah menjadikannya sebagai sumber terbuka, sehingga para trader dapat meninjau dan memverifikasi fungsinya. Salut untuk penulisnya! Meskipun Anda dapat menggunakannya secara gratis, perlu diingat bahwa penerbitan ulang kode ini tunduk pada Tata Tertib kami.
Pernyataan Penyangkalan
Informasi dan publikasi ini tidak dimaksudkan, dan bukan merupakan, saran atau rekomendasi keuangan, investasi, trading, atau jenis lainnya yang diberikan atau didukung oleh TradingView. Baca selengkapnya di Ketentuan Penggunaan.