OPEN-SOURCE SCRIPT
Diupdate PG Premium - Master Volatility Hub
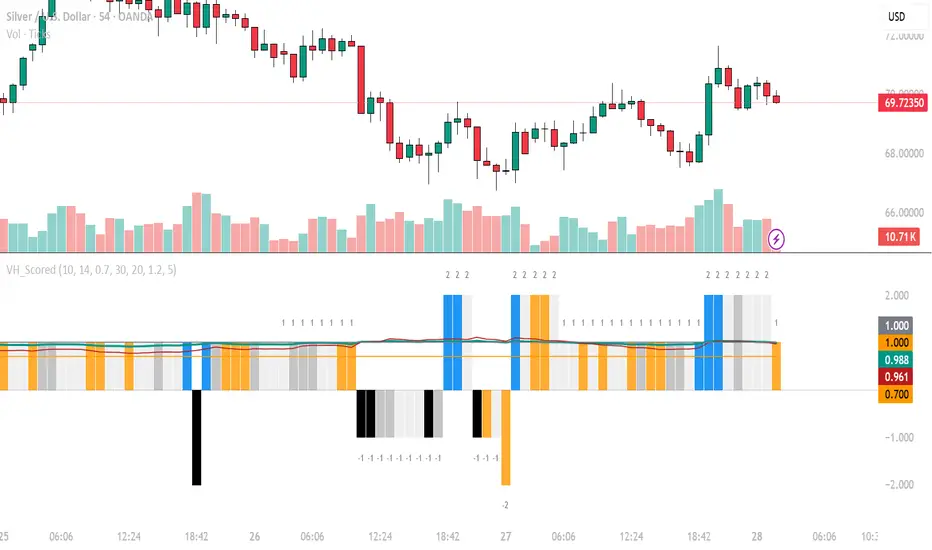
How to Interpret & Trade the Signals
1. The Volatility Squeeze (Preparation Phase)
Signal: Histogram bars turn Orange.
Meaning: The market is coiling. Range is < 70% of the average.
Action: Do not enter yet. This is the "loading" phase. Watch for which side the breakout occurs.
2. High-Conviction Bullish Breakout (Buy Signal)
Signal: A Royal Blue bar appears + Green Line (Crossover) climbs above 1.0.
Meaning: The squeeze has released to the upside with institutional volume.
Action: Potential Long entry. Place stop-loss at the low of the previous Orange squeeze zone.
3. High-Conviction Bearish Breakdown (Sell Signal)
Signal: A Pure Black bar appears + Green Line (Crossover) climbs above 1.0.
Meaning: Aggressive selling has entered the market.
Action: Potential Short entry. Place stop-loss at the high of the recent consolidation.
4. The "Hollow" Trap (Warning Signal)
Signal: Price moves significantly, but the bar is Dark Gray.
Meaning: This is a "low-fuel" move. Price is expanding, but volume is below the 1.2x threshold.
Action: Exercise caution. These moves often result in "v-shape" reversals or fake-outs.
Pro-Trading Tips
The Volatility Regime (Red Line): If the Red Line is rising above 1.0, the market is becoming generally more volatile. Expect wider swings and consider wider stop-losses. If it is below 1.0, the market is in a "quiet regime"—breakouts may be smaller.
The "Double Confirmation": The most powerful trades happen when a Blue/Black bar appears exactly as the Green Line crosses the 1.0 level from below. This confirms that both the single-bar range and the multi-bar average are expanding at the same time.
Suggested "Release Note" Summary for Users
"For best results, use this on the 1H or 4H timeframes to filter out intraday noise. This indicator does not predict direction—it identifies Conviction. Always align the Blue/Black signals with your existing trend-following strategy or key Support/Resistance levels."
1. The Volatility Squeeze (Preparation Phase)
Signal: Histogram bars turn Orange.
Meaning: The market is coiling. Range is < 70% of the average.
Action: Do not enter yet. This is the "loading" phase. Watch for which side the breakout occurs.
2. High-Conviction Bullish Breakout (Buy Signal)
Signal: A Royal Blue bar appears + Green Line (Crossover) climbs above 1.0.
Meaning: The squeeze has released to the upside with institutional volume.
Action: Potential Long entry. Place stop-loss at the low of the previous Orange squeeze zone.
3. High-Conviction Bearish Breakdown (Sell Signal)
Signal: A Pure Black bar appears + Green Line (Crossover) climbs above 1.0.
Meaning: Aggressive selling has entered the market.
Action: Potential Short entry. Place stop-loss at the high of the recent consolidation.
4. The "Hollow" Trap (Warning Signal)
Signal: Price moves significantly, but the bar is Dark Gray.
Meaning: This is a "low-fuel" move. Price is expanding, but volume is below the 1.2x threshold.
Action: Exercise caution. These moves often result in "v-shape" reversals or fake-outs.
Pro-Trading Tips
The Volatility Regime (Red Line): If the Red Line is rising above 1.0, the market is becoming generally more volatile. Expect wider swings and consider wider stop-losses. If it is below 1.0, the market is in a "quiet regime"—breakouts may be smaller.
The "Double Confirmation": The most powerful trades happen when a Blue/Black bar appears exactly as the Green Line crosses the 1.0 level from below. This confirms that both the single-bar range and the multi-bar average are expanding at the same time.
Suggested "Release Note" Summary for Users
"For best results, use this on the 1H or 4H timeframes to filter out intraday noise. This indicator does not predict direction—it identifies Conviction. Always align the Blue/Black signals with your existing trend-following strategy or key Support/Resistance levels."
Catatan Rilis
How to Interpret & Trade the Signals1. The Volatility Squeeze (Preparation Phase)
Signal: Histogram bars turn Orange.
Meaning: The market is coiling. Range is < 70% of the average.
Action: Do not enter yet. This is the "loading" phase. Watch for which side the breakout occurs.
2. High-Conviction Bullish Breakout (Buy Signal)
Signal: A Royal Blue bar appears + Green Line (Crossover) climbs above 1.0.
Meaning: The squeeze has released to the upside with institutional volume.
Action: Potential Long entry. Place stop-loss at the low of the previous Orange squeeze zone.
3. High-Conviction Bearish Breakdown (Sell Signal)
Signal: A Pure Black bar appears + Green Line (Crossover) climbs above 1.0.
Meaning: Aggressive selling has entered the market.
Action: Potential Short entry. Place stop-loss at the high of the recent consolidation.
4. The "Hollow" Trap (Warning Signal)
Signal: Price moves significantly, but the bar is Dark Gray.
Meaning: This is a "low-fuel" move. Price is expanding, but volume is below the 1.2x threshold.
Action: Exercise caution. These moves often result in "v-shape" reversals or fake-outs.
Pro-Trading Tips
The Volatility Regime (Red Line): If the Red Line is rising above 1.0, the market is becoming generally more volatile. Expect wider swings and consider wider stop-losses. If it is below 1.0, the market is in a "quiet regime"—breakouts may be smaller.
The "Double Confirmation": The most powerful trades happen when a Blue/Black bar appears exactly as the Green Line crosses the 1.0 level from below. This confirms that both the single-bar range and the multi-bar average are expanding at the same time.
Suggested "Release Note" Summary for Users
"For best results, use this on the 1H or 4H timeframes to filter out intraday noise. This indicator does not predict direction—it identifies Conviction. Always align the Blue/Black signals with your existing trend-following strategy or key Support/Resistance levels."
Catatan Rilis
How to Interpret & Trade the Signals1. The Volatility Squeeze (Preparation Phase)
Signal: Histogram bars turn Orange.
Meaning: The market is coiling. Range is < 70% of the average.
Action: Do not enter yet. This is the "loading" phase. Watch for which side the breakout occurs.
2. High-Conviction Bullish Breakout (Buy Signal)
Signal: A Royal Blue bar appears + Green Line (Crossover) climbs above 1.0.
Meaning: The squeeze has released to the upside with institutional volume.
Action: Potential Long entry. Place stop-loss at the low of the previous Orange squeeze zone.
3. High-Conviction Bearish Breakdown (Sell Signal)
Signal: A Pure Black bar appears + Green Line (Crossover) climbs above 1.0.
Meaning: Aggressive selling has entered the market.
Action: Potential Short entry. Place stop-loss at the high of the recent consolidation.
4. The "Hollow" Trap (Warning Signal)
Signal: Price moves significantly, but the bar is Dark Gray.
Meaning: This is a "low-fuel" move. Price is expanding, but volume is below the 1.2x threshold.
Action: Exercise caution. These moves often result in "v-shape" reversals or fake-outs.
Pro-Trading Tips
The Volatility Regime (Red Line): If the Red Line is rising above 1.0, the market is becoming generally more volatile. Expect wider swings and consider wider stop-losses. If it is below 1.0, the market is in a "quiet regime"—breakouts may be smaller.
The "Double Confirmation": The most powerful trades happen when a Blue/Black bar appears exactly as the Green Line crosses the 1.0 level from below. This confirms that both the single-bar range and the multi-bar average are expanding at the same time.
Suggested "Release Note" Summary for Users
"For best results, use this on the 1H or 4H timeframes to filter out intraday noise. This indicator does not predict direction—it identifies Conviction. Always align the Blue/Black signals with your existing trend-following strategy or key Support/Resistance levels."
Catatan Rilis
How to Interpret & Trade the Signals1. The Volatility Squeeze (Preparation Phase)
Signal: Histogram bars turn Orange.
Meaning: The market is coiling. Range is < 70% of the average.
Action: Do not enter yet. This is the "loading" phase. Watch for which side the breakout occurs.
2. High-Conviction Bullish Breakout (Buy Signal)
Signal: A Royal Blue bar appears + Green Line (Crossover) climbs above 1.0.
Meaning: The squeeze has released to the upside with institutional volume.
Action: Potential Long entry. Place stop-loss at the low of the previous Orange squeeze zone.
3. High-Conviction Bearish Breakdown (Sell Signal)
Signal: A Pure Black bar appears + Green Line (Crossover) climbs above 1.0.
Meaning: Aggressive selling has entered the market.
Action: Potential Short entry. Place stop-loss at the high of the recent consolidation.
4. The "Hollow" Trap (Warning Signal)
Signal: Price moves significantly, but the bar is Dark Gray.
Meaning: This is a "low-fuel" move. Price is expanding, but volume is below the 1.2x threshold.
Action: Exercise caution. These moves often result in "v-shape" reversals or fake-outs.
Pro-Trading Tips
The Volatility Regime (Red Line): If the Red Line is rising above 1.0, the market is becoming generally more volatile. Expect wider swings and consider wider stop-losses. If it is below 1.0, the market is in a "quiet regime"—breakouts may be smaller.
The "Double Confirmation": The most powerful trades happen when a Blue/Black bar appears exactly as the Green Line crosses the 1.0 level from below. This confirms that both the single-bar range and the multi-bar average are expanding at the same time.
Suggested "Release Note" Summary for Users
"For best results, use this on the 1H or 4H timeframes to filter out intraday noise. This indicator does not predict direction—it identifies Conviction. Always align the Blue/Black signals with your existing trend-following strategy or key Support/Resistance levels."
Catatan Rilis
How to Interpret & Trade the Signals1. The Volatility Squeeze (Preparation Phase)
Signal: Histogram bars turn Orange.
Meaning: The market is coiling. Range is < 70% of the average.
Action: Do not enter yet. This is the "loading" phase. Watch for which side the breakout occurs.
2. High-Conviction Bullish Breakout (Buy Signal)
Signal: A Royal Blue bar appears + Green Line (Crossover) climbs above 1.0.
Meaning: The squeeze has released to the upside with institutional volume.
Action: Potential Long entry. Place stop-loss at the low of the previous Orange squeeze zone.
3. High-Conviction Bearish Breakdown (Sell Signal)
Signal: A Pure Black bar appears + Green Line (Crossover) climbs above 1.0.
Meaning: Aggressive selling has entered the market.
Action: Potential Short entry. Place stop-loss at the high of the recent consolidation.
4. The "Hollow" Trap (Warning Signal)
Signal: Price moves significantly, but the bar is Dark Gray.
Meaning: This is a "low-fuel" move. Price is expanding, but volume is below the 1.2x threshold.
Action: Exercise caution. These moves often result in "v-shape" reversals or fake-outs.
Pro-Trading Tips
The Volatility Regime (Red Line): If the Red Line is rising above 1.0, the market is becoming generally more volatile. Expect wider swings and consider wider stop-losses. If it is below 1.0, the market is in a "quiet regime"—breakouts may be smaller.
The "Double Confirmation": The most powerful trades happen when a Blue/Black bar appears exactly as the Green Line crosses the 1.0 level from below. This confirms that both the single-bar range and the multi-bar average are expanding at the same time.
Suggested "Release Note" Summary for Users
"For best results, use this on the 1H or 4H timeframes to filter out intraday noise. This indicator does not predict direction—it identifies Conviction. Always align the Blue/Black signals with your existing trend-following strategy or key Support/Resistance levels."
Skrip open-source
Dengan semangat TradingView yang sesungguhnya, pembuat skrip ini telah menjadikannya sebagai sumber terbuka, sehingga para trader dapat meninjau dan memverifikasi fungsinya. Salut untuk penulisnya! Meskipun Anda dapat menggunakannya secara gratis, perlu diingat bahwa penerbitan ulang kode ini tunduk pada Tata Tertib kami.

Follow @i2gain on X.COM
Pernyataan Penyangkalan
Informasi dan publikasi ini tidak dimaksudkan, dan bukan merupakan, saran atau rekomendasi keuangan, investasi, trading, atau jenis lainnya yang diberikan atau didukung oleh TradingView. Baca selengkapnya di Ketentuan Penggunaan.
Skrip open-source
Dengan semangat TradingView yang sesungguhnya, pembuat skrip ini telah menjadikannya sebagai sumber terbuka, sehingga para trader dapat meninjau dan memverifikasi fungsinya. Salut untuk penulisnya! Meskipun Anda dapat menggunakannya secara gratis, perlu diingat bahwa penerbitan ulang kode ini tunduk pada Tata Tertib kami.
Follow @i2gain on X.COM
Pernyataan Penyangkalan
Informasi dan publikasi ini tidak dimaksudkan, dan bukan merupakan, saran atau rekomendasi keuangan, investasi, trading, atau jenis lainnya yang diberikan atau didukung oleh TradingView. Baca selengkapnya di Ketentuan Penggunaan.