OPEN-SOURCE SCRIPT
Koda Liquidity Sweep
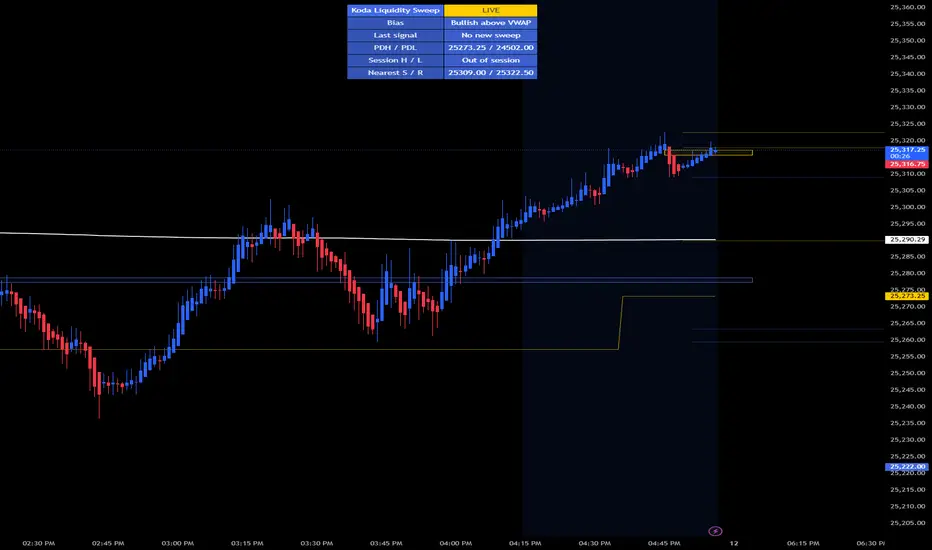
KODA LIQUIDITY SWEEP TRADINGVIEW INDICATOR
Koda Liquidity Sweep is a session-aware liquidity sweep indicator designed to help traders identify high-probability reversal setups while filtering out weak breakouts and low-quality fadeouts.
Instead of marking every break of a high or low, this script focuses on identifying what it defines as a real sweep — a meaningful liquidity event where price raids a level, rejects it, and shows confirmation that the move was a trap rather than continuation.
The goal is simple:
fewer signals, higher quality, cleaner charts
________________________________________
What the Indicator Does
This script identifies moments where price interacts with liquidity pools — areas where traders typically place:
• stop losses
• breakout entries
• pending orders
These areas are commonly found at:
• previous highs and lows
• session highs and lows
• support and resistance levels
• fair value gaps (imbalances)
When price moves into these areas, the script determines whether:
• it’s a true liquidity grab (reversal likely)
• or just continuation (no signal)
Only when strict conditions are met does it print:
• KLS BUY → bullish sweep
• KLS SELL → bearish sweep
________________________________________
What Makes This Indicator Different
Most indicators detect simple breakouts or reversals.
Koda Liquidity Sweep is different because it filters aggressively.
A signal is only printed when multiple conditions align:
• price raids beyond a level by a meaningful distance
• price rejects and closes back through the level
• the candle shows displacement (strength)
• wick structure confirms rejection
• optional VWAP and volume confirmation
This eliminates:
• weak poke-throughs
• slow grind breakouts
• random noise in the middle of ranges
________________________________________
Core Concepts Behind the Indicator
1. Liquidity Sweeps
Markets often move toward liquidity before reversing.
Example:
• price breaks above a high → triggers buy stops
• then reverses → trapping traders
This is what the script detects and labels as a sweep.
________________________________________
2. Rejection
A real sweep must show rejection:
• price goes beyond a level
• then quickly comes back
This is measured using:
• candle close
• wick size
________________________________________
3. Displacement
Strong moves matter.
The script uses ATR-based displacement to ensure:
• the move has real momentum
• not just slow drifting price action
________________________________________
4. VWAP (White Line)
VWAP represents fair value.
• Above VWAP → bullish bias
• Below VWAP → bearish bias
It acts as a directional filter to improve trade quality.
________________________________________
5. Volume
Optional volume filtering ensures:
• sweeps occur with participation
• low-volume fake moves are ignored
________________________________________
6. Fair Value Gaps (FVG)
• 🟦 Blue box = Bullish FVG (support zone)
• 🟨 Yellow box = Bearish FVG (resistance zone)
These represent areas where price moved too fast and may return.
________________________________________
7. Key Levels (Lines)
• 🔵 Blue lines → support / session levels
• 🟧 Yellow/Orange lines → resistance / PDH/PDL
These are liquidity targets where sweeps are most likely.
________________________________________
What is a “Real Sweep” in This Script
A valid sweep must include:
• a clear raid beyond a level
• a minimum distance beyond that level
• a close back through the level
• strong rejection wick
• displacement candle
• optional VWAP alignment
• optional volume confirmation
This is what filters out false signals and fadeouts.
________________________________________
Signals
KLS BUY
• price sweeps below a key level
• rejects and moves back up
Indicates potential bullish reversal
________________________________________
KLS SELL
• price sweeps above a key level
• rejects and moves back down
Indicates potential bearish reversal
________________________________________
Session & Market Adaptation
The script automatically adjusts behavior based on:
Markets
• NQ → stricter (fast, volatile)
• Gold → allows deeper wicks
• Forex → softer thresholds
________________________________________
Sessions
• New York AM → strong displacement, high volume
• London → structured liquidity runs
• Asian → slower, lower volatility
Each session uses slightly different filters to reflect real market behavior.
________________________________________
How to Use the Indicator
Basic workflow:
1. Identify session (NY, London, Asian)
2. Watch price approach a key level
3. Wait for a KLS signal
4. Confirm with:
o VWAP direction
o FVG location
o nearby support/resistance
________________________________________
Example (Short):
• price hits previous high
• sweeps above
• prints KLS SELL
• below VWAP
look for short setup
________________________________________
Example (Long):
• price sweeps below session low
• prints KLS BUY
• above VWAP
look for long setup
________________________________________
Chart Elements Summary
• 🟦 Blue box → bullish FVG (support)
• 🟨 Yellow box → bearish FVG (resistance)
• ⚪ White line → VWAP
• 🔵 Blue lines → support / session levels
• 🟧 Yellow/orange lines → resistance / PDH/PDL
• KLS labels → confirmed sweep signals
________________________________________
Best Use Cases
This indicator is ideal for:
• NQ scalping
• Gold intraday trading
• London session setups
• New York AM reversals
• liquidity-based trading strategies
________________________________________
Final Note
Koda Liquidity Sweep is built on one principle:
The best moves often come after liquidity is taken.
This tool helps you:
• identify those moments
• filter out noise
• and focus on where real market intent is likely happening
Koda Liquidity Sweep is a session-aware liquidity sweep indicator designed to help traders identify high-probability reversal setups while filtering out weak breakouts and low-quality fadeouts.
Instead of marking every break of a high or low, this script focuses on identifying what it defines as a real sweep — a meaningful liquidity event where price raids a level, rejects it, and shows confirmation that the move was a trap rather than continuation.
The goal is simple:
fewer signals, higher quality, cleaner charts
________________________________________
What the Indicator Does
This script identifies moments where price interacts with liquidity pools — areas where traders typically place:
• stop losses
• breakout entries
• pending orders
These areas are commonly found at:
• previous highs and lows
• session highs and lows
• support and resistance levels
• fair value gaps (imbalances)
When price moves into these areas, the script determines whether:
• it’s a true liquidity grab (reversal likely)
• or just continuation (no signal)
Only when strict conditions are met does it print:
• KLS BUY → bullish sweep
• KLS SELL → bearish sweep
________________________________________
What Makes This Indicator Different
Most indicators detect simple breakouts or reversals.
Koda Liquidity Sweep is different because it filters aggressively.
A signal is only printed when multiple conditions align:
• price raids beyond a level by a meaningful distance
• price rejects and closes back through the level
• the candle shows displacement (strength)
• wick structure confirms rejection
• optional VWAP and volume confirmation
This eliminates:
• weak poke-throughs
• slow grind breakouts
• random noise in the middle of ranges
________________________________________
Core Concepts Behind the Indicator
1. Liquidity Sweeps
Markets often move toward liquidity before reversing.
Example:
• price breaks above a high → triggers buy stops
• then reverses → trapping traders
This is what the script detects and labels as a sweep.
________________________________________
2. Rejection
A real sweep must show rejection:
• price goes beyond a level
• then quickly comes back
This is measured using:
• candle close
• wick size
________________________________________
3. Displacement
Strong moves matter.
The script uses ATR-based displacement to ensure:
• the move has real momentum
• not just slow drifting price action
________________________________________
4. VWAP (White Line)
VWAP represents fair value.
• Above VWAP → bullish bias
• Below VWAP → bearish bias
It acts as a directional filter to improve trade quality.
________________________________________
5. Volume
Optional volume filtering ensures:
• sweeps occur with participation
• low-volume fake moves are ignored
________________________________________
6. Fair Value Gaps (FVG)
• 🟦 Blue box = Bullish FVG (support zone)
• 🟨 Yellow box = Bearish FVG (resistance zone)
These represent areas where price moved too fast and may return.
________________________________________
7. Key Levels (Lines)
• 🔵 Blue lines → support / session levels
• 🟧 Yellow/Orange lines → resistance / PDH/PDL
These are liquidity targets where sweeps are most likely.
________________________________________
What is a “Real Sweep” in This Script
A valid sweep must include:
• a clear raid beyond a level
• a minimum distance beyond that level
• a close back through the level
• strong rejection wick
• displacement candle
• optional VWAP alignment
• optional volume confirmation
This is what filters out false signals and fadeouts.
________________________________________
Signals
KLS BUY
• price sweeps below a key level
• rejects and moves back up
Indicates potential bullish reversal
________________________________________
KLS SELL
• price sweeps above a key level
• rejects and moves back down
Indicates potential bearish reversal
________________________________________
Session & Market Adaptation
The script automatically adjusts behavior based on:
Markets
• NQ → stricter (fast, volatile)
• Gold → allows deeper wicks
• Forex → softer thresholds
________________________________________
Sessions
• New York AM → strong displacement, high volume
• London → structured liquidity runs
• Asian → slower, lower volatility
Each session uses slightly different filters to reflect real market behavior.
________________________________________
How to Use the Indicator
Basic workflow:
1. Identify session (NY, London, Asian)
2. Watch price approach a key level
3. Wait for a KLS signal
4. Confirm with:
o VWAP direction
o FVG location
o nearby support/resistance
________________________________________
Example (Short):
• price hits previous high
• sweeps above
• prints KLS SELL
• below VWAP
look for short setup
________________________________________
Example (Long):
• price sweeps below session low
• prints KLS BUY
• above VWAP
look for long setup
________________________________________
Chart Elements Summary
• 🟦 Blue box → bullish FVG (support)
• 🟨 Yellow box → bearish FVG (resistance)
• ⚪ White line → VWAP
• 🔵 Blue lines → support / session levels
• 🟧 Yellow/orange lines → resistance / PDH/PDL
• KLS labels → confirmed sweep signals
________________________________________
Best Use Cases
This indicator is ideal for:
• NQ scalping
• Gold intraday trading
• London session setups
• New York AM reversals
• liquidity-based trading strategies
________________________________________
Final Note
Koda Liquidity Sweep is built on one principle:
The best moves often come after liquidity is taken.
This tool helps you:
• identify those moments
• filter out noise
• and focus on where real market intent is likely happening
Skrip open-source
Dengan semangat TradingView yang sesungguhnya, pembuat skrip ini telah menjadikannya sebagai sumber terbuka, sehingga para trader dapat meninjau dan memverifikasi fungsinya. Salut untuk penulisnya! Meskipun Anda dapat menggunakannya secara gratis, perlu diingat bahwa penerbitan ulang kode ini tunduk pada Tata Tertib kami.

Pernyataan Penyangkalan
Informasi dan publikasi ini tidak dimaksudkan, dan bukan merupakan, saran atau rekomendasi keuangan, investasi, trading, atau jenis lainnya yang diberikan atau didukung oleh TradingView. Baca selengkapnya di Ketentuan Penggunaan.
Skrip open-source
Dengan semangat TradingView yang sesungguhnya, pembuat skrip ini telah menjadikannya sebagai sumber terbuka, sehingga para trader dapat meninjau dan memverifikasi fungsinya. Salut untuk penulisnya! Meskipun Anda dapat menggunakannya secara gratis, perlu diingat bahwa penerbitan ulang kode ini tunduk pada Tata Tertib kami.
Pernyataan Penyangkalan
Informasi dan publikasi ini tidak dimaksudkan, dan bukan merupakan, saran atau rekomendasi keuangan, investasi, trading, atau jenis lainnya yang diberikan atau didukung oleh TradingView. Baca selengkapnya di Ketentuan Penggunaan.