Dynamic Liquidity Draw [AlgoNorth]
Dynamic Liquidity Draw
Structure just turned. Where is the next pool of liquidity in that direction, and how far away is it? Most liquidity scripts cover the chart in levels and leave you to work out which one matters now. This one picks the nearest untaken pool on the side structure points to and draws the line from price to it.
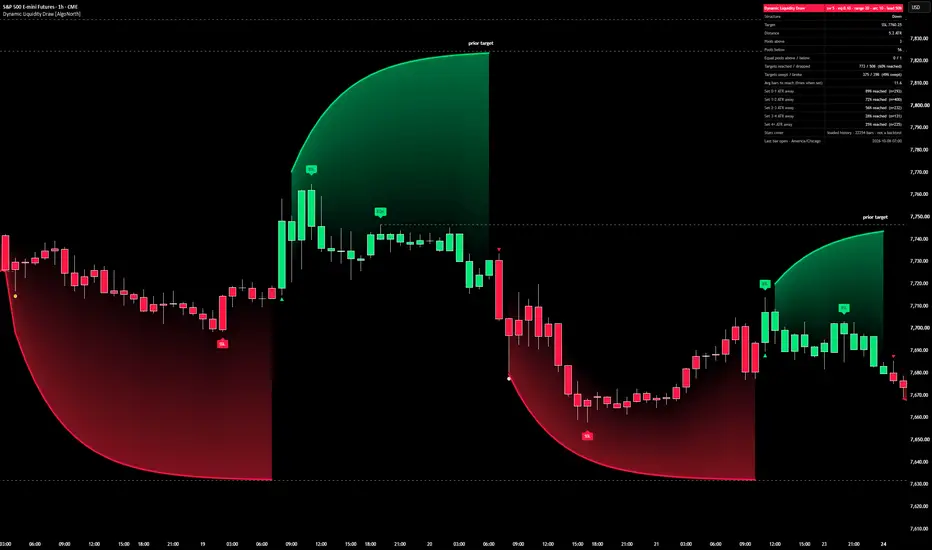
The line arcs onto the pool and holds there, green for a pool above, red for a pool below. When price takes it, or structure turns again, the line moves to the next one. Tags name each pool it targets, dots mark the bar that reaches it, and a panel keeps count of how often that happened on your chart.
🔶 USAGE
🔸 Follow the arc. The line eases from price onto the target pool and holds it until the pool is reached or structure flips. Green means the target is above price, red means below. Candles can take the same colour, with Colour candles by target side.
🔸 Read the tags. BSL is a swing high (buy-side liquidity), SSL a swing low (sell-side liquidity). EQH and EQL mark a pool that two or more swings share within the equal-pool tolerance. Tags sit on the candle that made the pool.
🔸 Watch the dots. When the target pool is reached, a dot marks the bar: gold for a sweep (price traded through and closed back inside), or in the chart's text colour for a break (price closed beyond the pool).
🔸 Prior targets. If structure flips before the target is reached, the pool keeps a dashed level labelled "prior target" until price trades through it.
🔸 Grey means no pool. When every pool on the structure side has been taken, a grey line follows the extreme still forming until a new swing is confirmed. Grey carries no tag, dot or count.
🔸 Read the panel. Structure, the current target and its distance in ATR, pools tracked on each side, targets reached and dropped, sweeps and breaks, average bars to reach, and reach rates by how far away the target was when it was set.
🔸 Alerts: pool reached above, pool reached below, pool swept, pool broken, target dropped. All fire at bar close.
🔶 DETAILS
🔸 Pools. A swing high or low with 5 bars each side, confirmed 5 bars after it forms. A pool stays on the list until price trades through it. The newest 60 per side are kept.
🔸 Equal pools. A new swing within 0.1 ATR of the nearest pool on its side joins that pool instead of making a new one. The pool keeps its own price.
🔸 Structure. Range breakout mode: a close above the highest high of the last 20 bars turns structure up, a close below the lowest low turns it down. Swing break mode uses a close beyond the latest structure swing instead. Structure only changes at a bar close.
🔸 The target. The nearest untaken pool on the structure side. It is held until reached or dropped, even if a nearer pool forms. Reached means price traded through it; a touch is not a take.
🔸 The arc. The line starts at the candle's extreme on the flip bar and eases toward the target over about 10 bars, then held at least 50% of the way from the candle toward the target and never past the candle itself. The shading runs from the line to a short average of close. The arc's shape is a drawing device; only its destination, the pool, is measured.
🔸 Reach rates. Every finished target is filed in the band its distance fell in when set (0–1, 1–2, 2–3, 3–4, 4+ ATR), and the panel shows what share of each band was reached before structure flipped. Nearer targets are reached more often by construction. These are counts over the loaded history, not a forecast and not a backtest. Counts are targets, not distinct pools: a pool dropped at a structure flip can be targeted again and is counted each time.
🔸 Price only. Pools are inferred from swing highs and lows. The script has no order data, so "liquidity" here means the levels where resting orders are commonly assumed to sit, not a measurement of them.
🔶 SETTINGS
🔸 Logic: Swing length, Equal pool tolerance, Structure mode, Structure length, Structure swing length, Arc length, Minimum lead toward pool, Edge smoothing, Oldest pool to target, Pools kept per side.
🔸 Style: Show arc and shading, Show forming extreme when no pool, Line width, Pool above and Pool below colours, Colour candles by target side, Shading strength, Mark untaken pools, Tag target pools, Pool tag size, Mark reached target pools, Sweep dot colour, Show prior targets, Prior target levels kept, Show live pool level, Show pool price tag, Mark structure flips.
🔸 Panel: Show panel, Panel corner. Four corners for when more than one copy is loaded.
🔶 NOTES
🔸 This is a context tool. It shows where the next pool is and keeps score; it doesn't give buy or sell signals. What you do with the read is up to you.
🔸 Nothing is drawn until the first structure break. From then on, every decision is made when a bar closes, and nothing on a closed bar is ever moved or redrawn.
🔸 Pool tags sit on the candle that made the pool, so you can see at a glance which swing is being targeted. A tag is written on the bar where its pool becomes the target, which is at least 5 bars after the swing formed and often more, and it stays exactly where it is from then on. Prior-target levels work the same way: drawn on the bar structure flips, starting from the pool's candle, and never changed afterwards. Read them as a record of which swings were targeted rather than a marker that appeared in real time.
🔸 Liquidity is read from price. Swing highs and lows stand in for where orders are assumed to rest; no order book or volume data is used.
🔸 The panel's rates come from the bars loaded on your chart, so each symbol and timeframe shows its own numbers, and more history changes them.
🔸 The newest 300 tags and 20 prior-target levels are kept.
🔸 The preview has Colour candles by target side switched on. It is off by default, so your own candle colours are kept until you turn it on.
🔸 Made for candle and bar charts. On Renko, Kagi and similar chart types the panel says the levels and rates differ.
🔶 SUMMARY
Dynamic Liquidity Draw picks the nearest untaken pool on the side structure points to and draws the line from price to it: green to a swing high above, red to a swing low below. Take the pool or turn structure, and the line moves on to the next one. Add it to your chart and see which pool the line is pointing to right now.
Structure just turned. Where is the next pool of liquidity in that direction, and how far away is it? Most liquidity scripts cover the chart in levels and leave you to work out which one matters now. This one picks the nearest untaken pool on the side structure points to and draws the line from price to it.
The line arcs onto the pool and holds there, green for a pool above, red for a pool below. When price takes it, or structure turns again, the line moves to the next one. Tags name each pool it targets, dots mark the bar that reaches it, and a panel keeps count of how often that happened on your chart.
🔶 USAGE
🔸 Follow the arc. The line eases from price onto the target pool and holds it until the pool is reached or structure flips. Green means the target is above price, red means below. Candles can take the same colour, with Colour candles by target side.
🔸 Read the tags. BSL is a swing high (buy-side liquidity), SSL a swing low (sell-side liquidity). EQH and EQL mark a pool that two or more swings share within the equal-pool tolerance. Tags sit on the candle that made the pool.
🔸 Watch the dots. When the target pool is reached, a dot marks the bar: gold for a sweep (price traded through and closed back inside), or in the chart's text colour for a break (price closed beyond the pool).
🔸 Prior targets. If structure flips before the target is reached, the pool keeps a dashed level labelled "prior target" until price trades through it.
🔸 Grey means no pool. When every pool on the structure side has been taken, a grey line follows the extreme still forming until a new swing is confirmed. Grey carries no tag, dot or count.
🔸 Read the panel. Structure, the current target and its distance in ATR, pools tracked on each side, targets reached and dropped, sweeps and breaks, average bars to reach, and reach rates by how far away the target was when it was set.
🔸 Alerts: pool reached above, pool reached below, pool swept, pool broken, target dropped. All fire at bar close.
🔶 DETAILS
🔸 Pools. A swing high or low with 5 bars each side, confirmed 5 bars after it forms. A pool stays on the list until price trades through it. The newest 60 per side are kept.
🔸 Equal pools. A new swing within 0.1 ATR of the nearest pool on its side joins that pool instead of making a new one. The pool keeps its own price.
🔸 Structure. Range breakout mode: a close above the highest high of the last 20 bars turns structure up, a close below the lowest low turns it down. Swing break mode uses a close beyond the latest structure swing instead. Structure only changes at a bar close.
🔸 The target. The nearest untaken pool on the structure side. It is held until reached or dropped, even if a nearer pool forms. Reached means price traded through it; a touch is not a take.
🔸 The arc. The line starts at the candle's extreme on the flip bar and eases toward the target over about 10 bars, then held at least 50% of the way from the candle toward the target and never past the candle itself. The shading runs from the line to a short average of close. The arc's shape is a drawing device; only its destination, the pool, is measured.
🔸 Reach rates. Every finished target is filed in the band its distance fell in when set (0–1, 1–2, 2–3, 3–4, 4+ ATR), and the panel shows what share of each band was reached before structure flipped. Nearer targets are reached more often by construction. These are counts over the loaded history, not a forecast and not a backtest. Counts are targets, not distinct pools: a pool dropped at a structure flip can be targeted again and is counted each time.
🔸 Price only. Pools are inferred from swing highs and lows. The script has no order data, so "liquidity" here means the levels where resting orders are commonly assumed to sit, not a measurement of them.
🔶 SETTINGS
🔸 Logic: Swing length, Equal pool tolerance, Structure mode, Structure length, Structure swing length, Arc length, Minimum lead toward pool, Edge smoothing, Oldest pool to target, Pools kept per side.
🔸 Style: Show arc and shading, Show forming extreme when no pool, Line width, Pool above and Pool below colours, Colour candles by target side, Shading strength, Mark untaken pools, Tag target pools, Pool tag size, Mark reached target pools, Sweep dot colour, Show prior targets, Prior target levels kept, Show live pool level, Show pool price tag, Mark structure flips.
🔸 Panel: Show panel, Panel corner. Four corners for when more than one copy is loaded.
🔶 NOTES
🔸 This is a context tool. It shows where the next pool is and keeps score; it doesn't give buy or sell signals. What you do with the read is up to you.
🔸 Nothing is drawn until the first structure break. From then on, every decision is made when a bar closes, and nothing on a closed bar is ever moved or redrawn.
🔸 Pool tags sit on the candle that made the pool, so you can see at a glance which swing is being targeted. A tag is written on the bar where its pool becomes the target, which is at least 5 bars after the swing formed and often more, and it stays exactly where it is from then on. Prior-target levels work the same way: drawn on the bar structure flips, starting from the pool's candle, and never changed afterwards. Read them as a record of which swings were targeted rather than a marker that appeared in real time.
🔸 Liquidity is read from price. Swing highs and lows stand in for where orders are assumed to rest; no order book or volume data is used.
🔸 The panel's rates come from the bars loaded on your chart, so each symbol and timeframe shows its own numbers, and more history changes them.
🔸 The newest 300 tags and 20 prior-target levels are kept.
🔸 The preview has Colour candles by target side switched on. It is off by default, so your own candle colours are kept until you turn it on.
🔸 Made for candle and bar charts. On Renko, Kagi and similar chart types the panel says the levels and rates differ.
🔶 SUMMARY
Dynamic Liquidity Draw picks the nearest untaken pool on the side structure points to and draws the line from price to it: green to a swing high above, red to a swing low below. Take the pool or turn structure, and the line moves on to the next one. Add it to your chart and see which pool the line is pointing to right now.

Pernyataan Penyangkalan
Informasi dan publikasi ini tidak dimaksudkan, dan bukan merupakan, saran atau rekomendasi keuangan, investasi, trading, atau jenis lainnya yang diberikan atau didukung oleh TradingView. Baca selengkapnya di Ketentuan Penggunaan.
Pernyataan Penyangkalan
Informasi dan publikasi ini tidak dimaksudkan, dan bukan merupakan, saran atau rekomendasi keuangan, investasi, trading, atau jenis lainnya yang diberikan atau didukung oleh TradingView. Baca selengkapnya di Ketentuan Penggunaan.