OPEN-SOURCE SCRIPT
Diupdate Previous Day/Week/Month High/Low
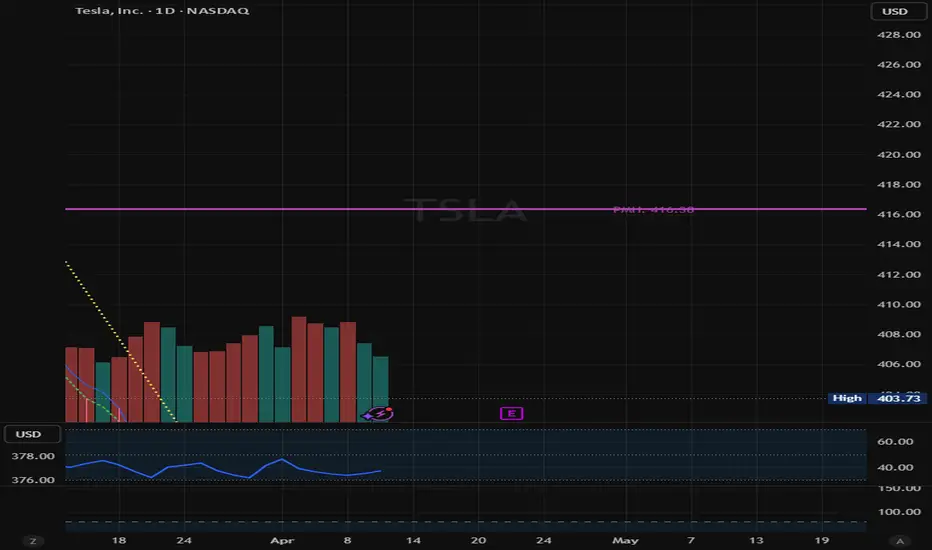
This script plots the previous day, week and month high and low.
Catatan Rilis
//version=6indicator("True Anchor H/L - Always-On Build", overlay=true, max_bars_back=5000)
// --- HELPER FUNCTION: Convert String to Line Style ---
getStyle(s) =>
s == "Dashed" ? line.style_dashed : s == "Dotted" ? line.style_dotted : line.style_solid
// --- GUI INPUTS ---
grp_g = "Global Settings"
label_off = input.int(6, "Label Vertical Offset (Ticks)", minval=0, group=grp_g)
// 10-Minute
grp_10 = "10-Minute Levels"
show_10 = input.bool(true, "Show P10mH/P10mL", group=grp_10)
col_10 = input.color(#9598a1, "Color", group=grp_10)
wid_10 = input.int(1, "Weight", minval=1, maxval=5, group=grp_10)
sty_10 = input.string("Solid", "Style", options=["Solid", "Dashed", "Dotted"], group=grp_10)
// Hourly
grp_h = "Hour Levels"
show_h = input.bool(true, "Show PHH/PHL", group=grp_h)
col_h = input.color(#ff9800, "Color", group=grp_h)
wid_h = input.int(1, "Weight", minval=1, maxval=5, group=grp_h)
sty_h = input.string("Solid", "Style", options=["Solid", "Dashed", "Dotted"], group=grp_h)
// Daily
grp_d = "Daily Levels"
show_d = input.bool(true, "Show Daily PDH/PDL", group=grp_d)
col_d = input.color(#86c7e6, "Color", group=grp_d)
wid_d = input.int(1, "Weight", minval=1, maxval=5, group=grp_d)
sty_d = input.string("Solid", "Style", options=["Solid", "Dashed", "Dotted"], group=grp_d)
// Weekly
grp_w = "Weekly Levels"
show_w = input.bool(true, "Show PWH/PWL", group=grp_w)
col_w = input.color(#e4bec4, "Color", group=grp_w)
wid_w = input.int(2, "Weight", minval=1, maxval=5, group=grp_w)
sty_w = input.string("Solid", "Style", options=["Solid", "Dashed", "Dotted"], group=grp_w)
// Monthly
grp_m = "Monthly Levels"
show_m = input.bool(true, "Show Monthly PMH/PML", group=grp_m)
col_m = input.color(#ac43ac, "Color", group=grp_m)
wid_m = input.int(2, "Weight", minval=1, maxval=5, group=grp_m)
sty_m = input.string("Solid", "Style", options=["Solid", "Dashed", "Dotted"], group=grp_m)
// --- 1. Fetch Price Levels ---
p10h = request.security(syminfo.tickerid, "10", high[1], lookahead=barmerge.lookahead_on)
p10l = request.security(syminfo.tickerid, "10", low[1], lookahead=barmerge.lookahead_on)
phh = request.security(syminfo.tickerid, "60", high[1], lookahead=barmerge.lookahead_on)
phl = request.security(syminfo.tickerid, "60", low[1], lookahead=barmerge.lookahead_on)
phd = request.security(syminfo.tickerid, "D", high[1], lookahead=barmerge.lookahead_on)
pld = request.security(syminfo.tickerid, "D", low[1], lookahead=barmerge.lookahead_on)
phw = request.security(syminfo.tickerid, "W", high[1], lookahead=barmerge.lookahead_on)
plw = request.security(syminfo.tickerid, "W", low[1], lookahead=barmerge.lookahead_on)
phm = request.security(syminfo.tickerid, "M", high[1], lookahead=barmerge.lookahead_on)
plm = request.security(syminfo.tickerid, "M", low[1], lookahead=barmerge.lookahead_on)
// --- 2. Anchoring Logic ---
tenMinAnchor = ta.valuewhen(ta.change(time("10")) != 0, bar_index, 1)
hourAnchor = ta.valuewhen(ta.change(time("60")) != 0, bar_index, 1)
dayAnchor = ta.valuewhen(ta.change(time("D")) != 0, bar_index, 1)
weekAnchor = ta.valuewhen(ta.change(time("W")) != 0, bar_index, 1)
monthAnchor = ta.valuewhen(ta.change(time("M")) != 0, bar_index, 1)
// --- 3. Drawing Function ---
drawLevel(anchorBar, price, useColor, width, styleStr, labelText, xOffset, isVisible) =>
if isVisible and not na(price) and not na(anchorBar)
int startX = int(anchorBar)
int endX = bar_index
if startX >= endX
startX := endX - 1
line.new(startX, price, endX, price, xloc.bar_index, extend.right, useColor, style=getStyle(styleStr), width=width, force_overlay=true)
float labelY = price - (syminfo.mintick * label_off)
label.new(x=endX + xOffset, y=labelY, text=labelText, xloc=xloc.bar_index, color=color(na), textcolor=useColor, style=label.style_label_left, size=size.small, force_overlay=true)
// --- 4. Execution ---
if barstate.islast
// Cleanup
line_arr = line.all
if array.size(line_arr) > 0
for i = 0 to array.size(line_arr) - 1
line.delete(array.get(line_arr, i))
label_arr = label.all
if array.size(label_arr) > 0
for i = 0 to array.size(label_arr) - 1
label.delete(array.get(label_arr, i))
// Render Logic (Filters removed to ensure visibility on all timeframes)
drawLevel(tenMinAnchor, p10h, col_10, wid_10, sty_10, "P10mH", 1, show_10)
drawLevel(tenMinAnchor, p10l, col_10, wid_10, sty_10, "P10mL", 1, show_10)
drawLevel(hourAnchor, phh, col_h, wid_h, sty_h, "PHH", 4, show_h)
drawLevel(hourAnchor, phl, col_h, wid_h, sty_h, "PHL", 4, show_h)
drawLevel(dayAnchor, phd, col_d, wid_d, sty_d, "PDH", 7, show_d)
drawLevel(dayAnchor, pld, col_d, wid_d, sty_d, "PDL", 7, show_d)
drawLevel(weekAnchor, phw, col_w, wid_w, sty_w, "PWH", 10, show_w)
drawLevel(weekAnchor, plw, col_w, wid_w, sty_w, "PWL", 10, show_w)
drawLevel(monthAnchor, phm, col_m, wid_m, sty_m, "PMH", 13, show_m)
drawLevel(monthAnchor, plm, col_m, wid_m, sty_m, "PML", 13, show_m)
Catatan Rilis
This will help you plot previous high timeframe levels automatically.you can change line style, weight and text placement.
this will only show smaller time frames when you go to that time frame (i.e. the 1H will only show the 1D, 1W and 1M levels while the 10m frame will also plot the 10m levels)
Catatan Rilis
.Skrip open-source
Dengan semangat TradingView yang sesungguhnya, pembuat skrip ini telah menjadikannya sebagai sumber terbuka, sehingga para trader dapat meninjau dan memverifikasi fungsinya. Salut untuk penulisnya! Meskipun Anda dapat menggunakannya secara gratis, perlu diingat bahwa penerbitan ulang kode ini tunduk pada Tata Tertib kami.

Pernyataan Penyangkalan
Informasi dan publikasi ini tidak dimaksudkan, dan bukan merupakan, saran atau rekomendasi keuangan, investasi, trading, atau jenis lainnya yang diberikan atau didukung oleh TradingView. Baca selengkapnya di Ketentuan Penggunaan.
Skrip open-source
Dengan semangat TradingView yang sesungguhnya, pembuat skrip ini telah menjadikannya sebagai sumber terbuka, sehingga para trader dapat meninjau dan memverifikasi fungsinya. Salut untuk penulisnya! Meskipun Anda dapat menggunakannya secara gratis, perlu diingat bahwa penerbitan ulang kode ini tunduk pada Tata Tertib kami.
Pernyataan Penyangkalan
Informasi dan publikasi ini tidak dimaksudkan, dan bukan merupakan, saran atau rekomendasi keuangan, investasi, trading, atau jenis lainnya yang diberikan atau didukung oleh TradingView. Baca selengkapnya di Ketentuan Penggunaan.