Stretch z distance from session VWAP
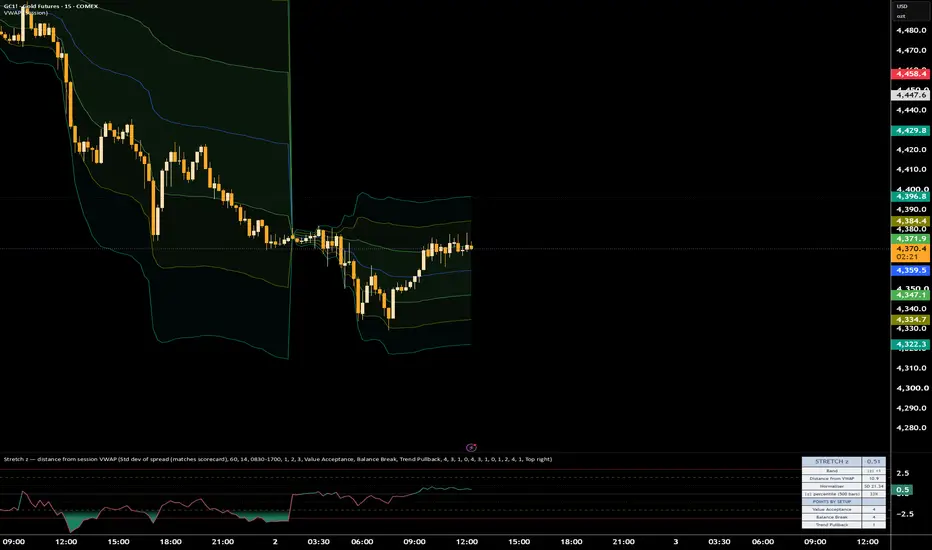
Stretch z — distance from session VWAP, normalised
Ten dollars from VWAP means something completely different on a dead Tuesday than it does thirty seconds after a number drops. Most "distance from VWAP" tools don't know that — they plot the raw dollar gap and leave you to eyeball whether it looks big today. This pane won't plot a number until it's been made to mean the same thing on any day, in any volatility regime, on any instrument.
The problem with a dollar amount
Raw distance from VWAP isn't comparable across sessions, let alone across symbols. A given point distance on gold during a quiet Asian session and the same point distance thirty seconds after a data release aren't the same event, even though the ruler says they are. The fix is standardisation: divide the raw distance by a measure of how far price normally sits from VWAP right now, and the number stops being "$10" and starts being "how unusual is this, given what unusual looks like today." Do that consistently and the reading also becomes portable — the same z = 2 means roughly the same thing on GC and on NQ, without retuning a single input between them.
Two normalisers, two different claims
You get an explicit choice, because the two options aren't interchangeable and I didn't want to hide that. Dividing by the rolling standard deviation of the spread produces an actual z-score — a statement about how many typical deviations price currently sits from VWAP, with the probabilistic interpretation that implies. Dividing by daily ATR instead produces a distance expressed in units of a familiar, point-based measure — easier to reason about at a glance, portable across timeframes you already think in ATR terms, but it is not a z-score, and the same band thresholds mean something different depending on which one you picked. The tool doesn't pretend these are the same thing wearing different clothes.
Don't trust a variance estimate you just started counting
There are two ways to estimate "normal" dispersion, and each has a real cost. A rolling window (60 bars by default) gives a stable estimate built on a real sample size, but it can straddle a session boundary — at 09:35 that window is still mostly measuring yesterday's regime, not today's. A session-anchored estimate restarts at the open and builds its variance forward, bar by bar, from a running sum and sum-of-squares (with Bessel's correction applied for a proper sample variance) — statistically cleaner, because it only ever describes the session you're actually in, but noisy and untrustworthy for the first handful of bars, when "normal dispersion" is being estimated off three or four data points. Rather than plot a confident-looking number built on a sample too small to support it, the pane suppresses the reading — and the alerts — until the estimate has enough bars behind it to mean something.
A parametric score deserves a non-parametric gut check
A z-score's "how unusual is this" framing leans on the reading behaving roughly like a normal distribution, and a futures spread doesn't always cooperate with that assumption. So alongside the z-score itself, the readout reports where the current |z| ranks against its own trailing 500-bar history — the same question, asked empirically, without needing the distribution to be well-behaved. If the two ever disagree meaningfully, that disagreement is informative on its own.
The bands aren't decorative — they're calibrated
Distance from VWAP isn't universally good or bad; what it means depends entirely on what you're trying to do with it. The readout scores the same z-band differently for three separate trade setups, and the weighting isn't monotonic in the same direction for all three — one setup scores highest when price sits close to VWAP and falls off as stretch increases, while another actually peaks in the 2–3σ band rather than near zero, which lines up with what earlier backtesting on that setup already found. Treating "how stretched is price" as a conditioning variable that different setups respond to differently, rather than a single filter everyone reads the same way, is the actual point of the table — a live, at-a-glance version of a relationship that was originally found by looking backward, not a number invented for the chart.
How I actually use it
Before taking any of the three setups this table tracks, I check the band and the points column, not just the raw z-score — a "big" z-score isn't automatically good or bad news, and the table already tells me which setup it favors and which it doesn't. The percentile column is my sanity check against the regime itself: a 2–3σ reading on a slow, thin session is a genuinely rare event; the same reading thirty seconds into a volatile one might barely be top-quartile, and the percentile is what tells the two apart when the z-score alone can't. The two band-cross alerts do the actual watching — I don't need to sit on the pane all session waiting for the reading to become interesting; it tells me when it has.
(Default window length and weights are set to match a scoring workbook I built earlier in this framework — you don't need that workbook to use this pane, but if the defaults look oddly specific, that's why.)
No time travel
Session VWAP is a standard, non-repainting session-anchored calculation. Daily ATR is retrieved through a security request with lookahead explicitly disabled and offset by one bar before the request, the documented non-repainting pattern for higher-timeframe data. Nothing on the pane, and no alert it fires, depends on information that wasn't available at the time.
What's proven, and what isn't yet
The normalisation logic and the small-sample discipline are sound on their own statistical merits — that part doesn't need a backtest to justify it. The per-setup weights are a different matter: they encode a relationship I'd already found in earlier research on this framework's setups, not a fresh statistical test run by this indicator itself, and the three band edges (1σ, 2σ, 3σ) are conventional defaults rather than something optimised inside this script. A companion scoring workbook in the same framework carries Monte-Carlo-validated adaptive thresholds; this pane trades that adaptivity for a lighter, always-on read, and it's worth knowing which tool you're looking at if the two ever disagree.
Limitations
Runs on any TradingView plan — unlike footprint-based tools, this only needs price and volume, not order-by-order data.
Built for standard candlestick charts; since it emits alertconditions, treat it like any signal-generating script and avoid Heikin Ashi, Renko, or other synthetic chart types.
Session-anchored mode needs roughly 20 bars into the session before its reading is trustworthy; the pane stays blank until then rather than show a number that isn't earned yet.
Default bands and setup weights are tuned for the framework and instrument I built this on; treat them as a starting point, not a universal constant, on a different symbol or session.
Ten dollars from VWAP means something completely different on a dead Tuesday than it does thirty seconds after a number drops. Most "distance from VWAP" tools don't know that — they plot the raw dollar gap and leave you to eyeball whether it looks big today. This pane won't plot a number until it's been made to mean the same thing on any day, in any volatility regime, on any instrument.
The problem with a dollar amount
Raw distance from VWAP isn't comparable across sessions, let alone across symbols. A given point distance on gold during a quiet Asian session and the same point distance thirty seconds after a data release aren't the same event, even though the ruler says they are. The fix is standardisation: divide the raw distance by a measure of how far price normally sits from VWAP right now, and the number stops being "$10" and starts being "how unusual is this, given what unusual looks like today." Do that consistently and the reading also becomes portable — the same z = 2 means roughly the same thing on GC and on NQ, without retuning a single input between them.
Two normalisers, two different claims
You get an explicit choice, because the two options aren't interchangeable and I didn't want to hide that. Dividing by the rolling standard deviation of the spread produces an actual z-score — a statement about how many typical deviations price currently sits from VWAP, with the probabilistic interpretation that implies. Dividing by daily ATR instead produces a distance expressed in units of a familiar, point-based measure — easier to reason about at a glance, portable across timeframes you already think in ATR terms, but it is not a z-score, and the same band thresholds mean something different depending on which one you picked. The tool doesn't pretend these are the same thing wearing different clothes.
Don't trust a variance estimate you just started counting
There are two ways to estimate "normal" dispersion, and each has a real cost. A rolling window (60 bars by default) gives a stable estimate built on a real sample size, but it can straddle a session boundary — at 09:35 that window is still mostly measuring yesterday's regime, not today's. A session-anchored estimate restarts at the open and builds its variance forward, bar by bar, from a running sum and sum-of-squares (with Bessel's correction applied for a proper sample variance) — statistically cleaner, because it only ever describes the session you're actually in, but noisy and untrustworthy for the first handful of bars, when "normal dispersion" is being estimated off three or four data points. Rather than plot a confident-looking number built on a sample too small to support it, the pane suppresses the reading — and the alerts — until the estimate has enough bars behind it to mean something.
A parametric score deserves a non-parametric gut check
A z-score's "how unusual is this" framing leans on the reading behaving roughly like a normal distribution, and a futures spread doesn't always cooperate with that assumption. So alongside the z-score itself, the readout reports where the current |z| ranks against its own trailing 500-bar history — the same question, asked empirically, without needing the distribution to be well-behaved. If the two ever disagree meaningfully, that disagreement is informative on its own.
The bands aren't decorative — they're calibrated
Distance from VWAP isn't universally good or bad; what it means depends entirely on what you're trying to do with it. The readout scores the same z-band differently for three separate trade setups, and the weighting isn't monotonic in the same direction for all three — one setup scores highest when price sits close to VWAP and falls off as stretch increases, while another actually peaks in the 2–3σ band rather than near zero, which lines up with what earlier backtesting on that setup already found. Treating "how stretched is price" as a conditioning variable that different setups respond to differently, rather than a single filter everyone reads the same way, is the actual point of the table — a live, at-a-glance version of a relationship that was originally found by looking backward, not a number invented for the chart.
How I actually use it
Before taking any of the three setups this table tracks, I check the band and the points column, not just the raw z-score — a "big" z-score isn't automatically good or bad news, and the table already tells me which setup it favors and which it doesn't. The percentile column is my sanity check against the regime itself: a 2–3σ reading on a slow, thin session is a genuinely rare event; the same reading thirty seconds into a volatile one might barely be top-quartile, and the percentile is what tells the two apart when the z-score alone can't. The two band-cross alerts do the actual watching — I don't need to sit on the pane all session waiting for the reading to become interesting; it tells me when it has.
(Default window length and weights are set to match a scoring workbook I built earlier in this framework — you don't need that workbook to use this pane, but if the defaults look oddly specific, that's why.)
No time travel
Session VWAP is a standard, non-repainting session-anchored calculation. Daily ATR is retrieved through a security request with lookahead explicitly disabled and offset by one bar before the request, the documented non-repainting pattern for higher-timeframe data. Nothing on the pane, and no alert it fires, depends on information that wasn't available at the time.
What's proven, and what isn't yet
The normalisation logic and the small-sample discipline are sound on their own statistical merits — that part doesn't need a backtest to justify it. The per-setup weights are a different matter: they encode a relationship I'd already found in earlier research on this framework's setups, not a fresh statistical test run by this indicator itself, and the three band edges (1σ, 2σ, 3σ) are conventional defaults rather than something optimised inside this script. A companion scoring workbook in the same framework carries Monte-Carlo-validated adaptive thresholds; this pane trades that adaptivity for a lighter, always-on read, and it's worth knowing which tool you're looking at if the two ever disagree.
Limitations
Runs on any TradingView plan — unlike footprint-based tools, this only needs price and volume, not order-by-order data.
Built for standard candlestick charts; since it emits alertconditions, treat it like any signal-generating script and avoid Heikin Ashi, Renko, or other synthetic chart types.
Session-anchored mode needs roughly 20 bars into the session before its reading is trustworthy; the pane stays blank until then rather than show a number that isn't earned yet.
Default bands and setup weights are tuned for the framework and instrument I built this on; treat them as a starting point, not a universal constant, on a different symbol or session.

Pernyataan Penyangkalan
Informasi dan publikasi ini tidak dimaksudkan, dan bukan merupakan, saran atau rekomendasi keuangan, investasi, trading, atau jenis lainnya yang diberikan atau didukung oleh TradingView. Baca selengkapnya di Ketentuan Penggunaan.
Pernyataan Penyangkalan
Informasi dan publikasi ini tidak dimaksudkan, dan bukan merupakan, saran atau rekomendasi keuangan, investasi, trading, atau jenis lainnya yang diberikan atau didukung oleh TradingView. Baca selengkapnya di Ketentuan Penggunaan.