Pivot Levels Breakouts [SMRT Algo]
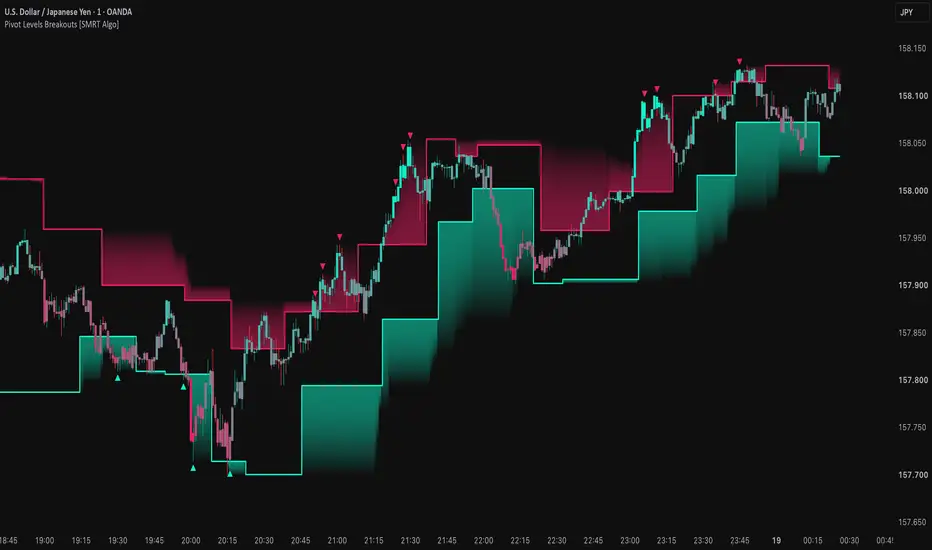
Pivot Levels Breakouts combines rolling price extremes, confirmed swing levels, and an EMA/ATR candle gradient in one overlay. It helps you see where recent price boundaries sit, how confirmed structure develops, and when a two-candle reversal pattern forms after price exceeds a rolling extreme.
The triangles highlight a specific price-action sequence: an excursion beyond a previous rolling high or low, followed by a candle that closes in the opposite direction. They do not, by themselves, confirm a sustained breakout or a completed trend reversal.

Two views of market structure
Rolling highs and lows
The indicator calculates the highest high and lowest low across the previous Pivot Lookback bars, excluding the current candle. With the default setting of 60, each bar is compared with the preceding 60-bar range. These boundaries update as new bars enter the window and older bars leave it.
Confirmed swing levels
Swing pivots use the same number of bars on each side of a candidate high or low. At the default Swing Pivot Strength of 8, a pivot needs eight subsequent bars before it can be confirmed. The latest confirmed high and low remain in place until a new pivot of the same type becomes available.
Pink and teal stepped lines represent confirmed swing resistance and support. Gradient shading connects these levels to the corresponding rolling extremes. The rolling boundaries act as the other edge of the shading; they are not drawn as separate visible lines in this version. The shaded areas describe the relationship between two price references, rather than a probability of support or resistance holding.
Confirmed swing levels appear when confirmation becomes available. They are not drawn back onto the original pivot candle.
How the BUY and SELL markers work
BUY — teal triangle below the signal candle
SELL — pink triangle above the signal candle
The marker is placed on the second candle. A wick beyond the rolling boundary is sufficient for the first condition; the previous candle does not need to close outside the range. The signal candle does not need to close back inside the range, engulf the previous candle, or cross a confirmed swing level. Doji candles do not satisfy the strict directional comparisons.

Reading the candle gradient
Candle colour reflects the close's distance from an EMA, scaled by ATR. The default lengths are 34 for the EMA and 14 for ATR.
As price moves further above the EMA, the colour moves toward teal. As it moves further below the EMA, the colour moves toward pink. At the EMA, the colour is the midpoint blend. The gradient reaches its endpoints at four ATR above or below the EMA and is capped beyond those distances.
Candle colour and candle direction are separate. A candle that closes below its open can still be teal if its close remains above the EMA. The marker conditions use the actual open and close, independently of the gradient. A pink SELL triangle on a teal candle is therefore possible and expected.
Settings that affect the displayed result
Current-version notes
The supplied version also contains Volume Baseline, Relative Volume Threshold, Require Volume Confirmation, Require Directional Volume Pressure, Breakout Buffer, Require Candle Body Beyond Level, Require Directional Candle, and Trend Noise Filter controls. These are not connected to the displayed signals, level plots, or candle gradient. Changing them does not alter those outputs. The fixed open/close direction checks described above still apply when Require Directional Candle is switched off.
Timing and limitations
On an open candle, a marker can appear or disappear as the current close changes. Evaluate the completed pattern after the signal candle closes. Candle colours also update intrabar, and a newly detected swing should be evaluated after its confirmation candle closes.
Markers can occur against a continuing trend and can be followed by further movement beyond the same boundary. The examples illustrate the indicator's behaviour, not a tested trading outcome. This is a chart overlay, with no built-in strategy backtest, trade execution, stop-loss or take-profit system, or dedicated alert conditions.
Free and open source
Released by SMRT Algo with source code available for inspection and learning under the Mozilla Public License 2.0. The calculations are available to review alongside the chart so users can understand exactly what each visual represents.
The triangles highlight a specific price-action sequence: an excursion beyond a previous rolling high or low, followed by a candle that closes in the opposite direction. They do not, by themselves, confirm a sustained breakout or a completed trend reversal.
Two views of market structure
Rolling highs and lows
The indicator calculates the highest high and lowest low across the previous Pivot Lookback bars, excluding the current candle. With the default setting of 60, each bar is compared with the preceding 60-bar range. These boundaries update as new bars enter the window and older bars leave it.
Confirmed swing levels
Swing pivots use the same number of bars on each side of a candidate high or low. At the default Swing Pivot Strength of 8, a pivot needs eight subsequent bars before it can be confirmed. The latest confirmed high and low remain in place until a new pivot of the same type becomes available.
Pink and teal stepped lines represent confirmed swing resistance and support. Gradient shading connects these levels to the corresponding rolling extremes. The rolling boundaries act as the other edge of the shading; they are not drawn as separate visible lines in this version. The shaded areas describe the relationship between two price references, rather than a probability of support or resistance holding.
Confirmed swing levels appear when confirmation becomes available. They are not drawn back onto the original pivot candle.
How the BUY and SELL markers work
BUY — teal triangle below the signal candle
- The previous candle's low is strictly below the rolling low that applied to that previous candle.
- That previous candle closes below its own open.
- The current candle closes above its own open.
SELL — pink triangle above the signal candle
- The previous candle's high is strictly above the rolling high that applied to that previous candle.
- That previous candle closes above its own open.
- The current candle closes below its own open.
The marker is placed on the second candle. A wick beyond the rolling boundary is sufficient for the first condition; the previous candle does not need to close outside the range. The signal candle does not need to close back inside the range, engulf the previous candle, or cross a confirmed swing level. Doji candles do not satisfy the strict directional comparisons.
Reading the candle gradient
Candle colour reflects the close's distance from an EMA, scaled by ATR. The default lengths are 34 for the EMA and 14 for ATR.
As price moves further above the EMA, the colour moves toward teal. As it moves further below the EMA, the colour moves toward pink. At the EMA, the colour is the midpoint blend. The gradient reaches its endpoints at four ATR above or below the EMA and is capped beyond those distances.
Candle colour and candle direction are separate. A candle that closes below its open can still be teal if its close remains above the EMA. The marker conditions use the actual open and close, independently of the gradient. A pink SELL triangle on a teal candle is therefore possible and expected.
Settings that affect the displayed result
- Pivot Lookback — 60: Sets the rolling range used for the shaded boundaries and marker comparisons. A larger value compares price with a broader history.
- Swing Pivot Strength — 8: Sets the left and right confirmation window for swing levels. Larger values require a longer confirmation delay. This setting does not filter the markers.
- Show Rolling Support / Resistance: Controls the rolling series used by the shaded zones. It does not disable the underlying marker calculations.
- Show Confirmed Swing Levels: Controls the stepped swing lines. The fills need both rolling and swing series to be enabled and available.
- Trend EMA Length — 34 / Trend ATR Length — 14: Control the candle gradient. They do not filter the BUY or SELL markers.
- Show BUY / SELL Signals: Toggles the triangles.
- BUY / SELL colours: Customize the corresponding markers, swing lines, fills, and gradient endpoints.
Current-version notes
The supplied version also contains Volume Baseline, Relative Volume Threshold, Require Volume Confirmation, Require Directional Volume Pressure, Breakout Buffer, Require Candle Body Beyond Level, Require Directional Candle, and Trend Noise Filter controls. These are not connected to the displayed signals, level plots, or candle gradient. Changing them does not alter those outputs. The fixed open/close direction checks described above still apply when Require Directional Candle is switched off.
Timing and limitations
On an open candle, a marker can appear or disappear as the current close changes. Evaluate the completed pattern after the signal candle closes. Candle colours also update intrabar, and a newly detected swing should be evaluated after its confirmation candle closes.
Markers can occur against a continuing trend and can be followed by further movement beyond the same boundary. The examples illustrate the indicator's behaviour, not a tested trading outcome. This is a chart overlay, with no built-in strategy backtest, trade execution, stop-loss or take-profit system, or dedicated alert conditions.
Free and open source
Released by SMRT Algo with source code available for inspection and learning under the Mozilla Public License 2.0. The calculations are available to review alongside the chart so users can understand exactly what each visual represents.

Get access: smrtalgo.com
Join our Discord: discord.com/invite/f7gVrMPkaC
All content provided by SMRT Algo is for informational & educational purposes only. Past performance does not guarantee future results.
Join our Discord: discord.com/invite/f7gVrMPkaC
All content provided by SMRT Algo is for informational & educational purposes only. Past performance does not guarantee future results.
Pernyataan Penyangkalan
Informasi dan publikasi ini tidak dimaksudkan, dan bukan merupakan, saran atau rekomendasi keuangan, investasi, trading, atau jenis lainnya yang diberikan atau didukung oleh TradingView. Baca selengkapnya di Ketentuan Penggunaan.
Get access: smrtalgo.com
Join our Discord: discord.com/invite/f7gVrMPkaC
All content provided by SMRT Algo is for informational & educational purposes only. Past performance does not guarantee future results.
Join our Discord: discord.com/invite/f7gVrMPkaC
All content provided by SMRT Algo is for informational & educational purposes only. Past performance does not guarantee future results.
Pernyataan Penyangkalan
Informasi dan publikasi ini tidak dimaksudkan, dan bukan merupakan, saran atau rekomendasi keuangan, investasi, trading, atau jenis lainnya yang diberikan atau didukung oleh TradingView. Baca selengkapnya di Ketentuan Penggunaan.