ATK/DEF The Spirit By Metal Power Swing Flow
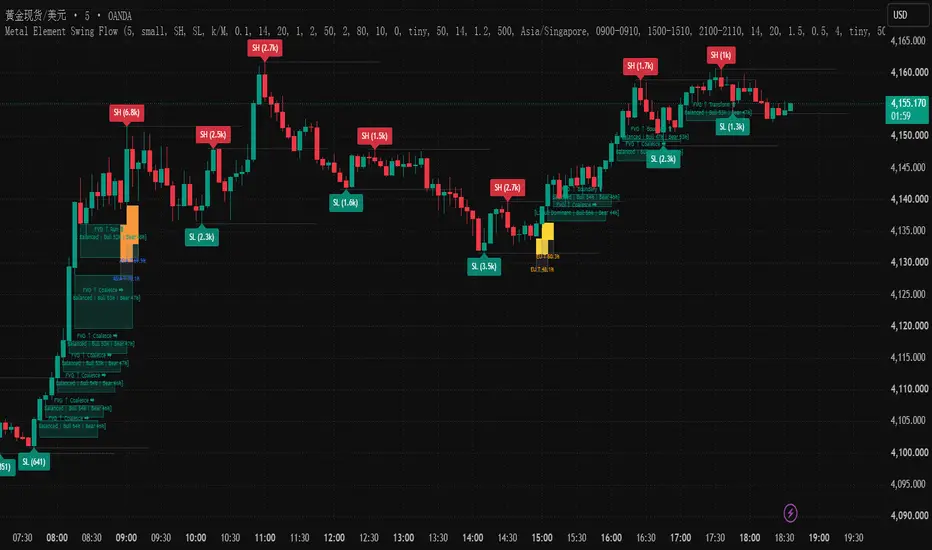
# ATK/DEF The Spirit By Metal Power Swing Flow
## Overview
ATK/DEF The Spirit By Metal Power Swing Flow is a multi-layer technical analysis indicator that combines swing structure, price-wave visualization, horizontal price levels, dual Fair Value Gap (FVG) tracking, directional candle-volume distribution, and session-based volatility readings.
It provides a unified visual framework for observing swing development, FVG interactions, candle-volume distribution, and relative volatility conditions.
## Core Features
### 1. Swing Structure & Wave Flow
- Identifies Swing Highs (SH) and Swing Lows (SL) using configurable pivot settings.
- Displays optional volume values at swing points.
- Supports multiple volume display formats.
- Uses ATR-based tolerance to filter nearby equal swing highs and lows.
- Connects alternating swing points with optional wave lines.
- Displays horizontal price levels with configurable extensions.
- Distinguishes touched and untouched levels according to the script's conditions.
### 2. Dual Fair Value Gap (FVG) Flow
Detects bullish and bearish Fair Value Gaps using three-candle price-gap conditions.
Each FVG includes a custom nine-stage sequence:
**Coalesce → Form → Boundary → Run → Filter → Converge → Transform → Conceal → Rebirth**
The indicator tracks these custom stages according to its internal rules and supports configurable gap appearance, minimum ATR-based gap size, maximum retention, age-based cleanup, and closing-price invalidation.
These stage names represent the indicator's custom logic and are not universal market classifications.
### 3. Directional Candle-Volume Distribution
Tracks bullish-candle and bearish-candle volume accumulated after an FVG forms.
The display can include volume percentages and one of three classifications:
- Bull Dominant
- Bear Dominant
- Balanced
Classification is based on a configurable volume-dominance threshold. This module uses candle direction and chart volume; it does not directly measure buyer-initiated or seller-initiated orders, institutional activity, or order-book liquidity.
### 4. Session Volatility Thermometer
Displays relative ATR-based volatility during configurable session windows.
Features include:
- Configurable timezone and session windows.
- Adjustable ATR length and historical averaging period.
- Color-coded relative volatility readings.
- Customizable display position and appearance.
The thermometer measures relative volatility according to the script's calculation rules. It is not a direct measure of market sentiment, liquidity depth, or future price direction.
## Analytical Framework
**Swing Structure** — Observes swing highs and lows, wave connections, and horizontal price levels.
**FVG Dynamics** — Tracks bullish and bearish gaps, custom stage progression, price interaction, and invalidation.
**Directional Volume Distribution** — Compares bullish-candle and bearish-candle volume associated with tracked FVGs.
**Session Volatility** — Observes relative ATR conditions during selected session windows.
Together, these components provide a visual framework for examining changes in market structure, gap behavior, candle-volume distribution, and relative volatility.
## Chart Examples
1.
2.
3.
4.
5.
## Important Notice
This indicator is provided for technical analysis and reference purposes only.
All labels, classifications, and visual readings are generated according to the script's predefined calculation rules. They do not guarantee future market behavior or outcomes and should not be treated as standalone confirmation of price direction.
Users should consider broader market conditions and conduct their own independent analysis.
## License
Mozilla Public License 2.0 (MPL-2.0)
## Overview
ATK/DEF The Spirit By Metal Power Swing Flow is a multi-layer technical analysis indicator that combines swing structure, price-wave visualization, horizontal price levels, dual Fair Value Gap (FVG) tracking, directional candle-volume distribution, and session-based volatility readings.
It provides a unified visual framework for observing swing development, FVG interactions, candle-volume distribution, and relative volatility conditions.
## Core Features
### 1. Swing Structure & Wave Flow
- Identifies Swing Highs (SH) and Swing Lows (SL) using configurable pivot settings.
- Displays optional volume values at swing points.
- Supports multiple volume display formats.
- Uses ATR-based tolerance to filter nearby equal swing highs and lows.
- Connects alternating swing points with optional wave lines.
- Displays horizontal price levels with configurable extensions.
- Distinguishes touched and untouched levels according to the script's conditions.
### 2. Dual Fair Value Gap (FVG) Flow
Detects bullish and bearish Fair Value Gaps using three-candle price-gap conditions.
Each FVG includes a custom nine-stage sequence:
**Coalesce → Form → Boundary → Run → Filter → Converge → Transform → Conceal → Rebirth**
The indicator tracks these custom stages according to its internal rules and supports configurable gap appearance, minimum ATR-based gap size, maximum retention, age-based cleanup, and closing-price invalidation.
These stage names represent the indicator's custom logic and are not universal market classifications.
### 3. Directional Candle-Volume Distribution
Tracks bullish-candle and bearish-candle volume accumulated after an FVG forms.
The display can include volume percentages and one of three classifications:
- Bull Dominant
- Bear Dominant
- Balanced
Classification is based on a configurable volume-dominance threshold. This module uses candle direction and chart volume; it does not directly measure buyer-initiated or seller-initiated orders, institutional activity, or order-book liquidity.
### 4. Session Volatility Thermometer
Displays relative ATR-based volatility during configurable session windows.
Features include:
- Configurable timezone and session windows.
- Adjustable ATR length and historical averaging period.
- Color-coded relative volatility readings.
- Customizable display position and appearance.
The thermometer measures relative volatility according to the script's calculation rules. It is not a direct measure of market sentiment, liquidity depth, or future price direction.
## Analytical Framework
**Swing Structure** — Observes swing highs and lows, wave connections, and horizontal price levels.
**FVG Dynamics** — Tracks bullish and bearish gaps, custom stage progression, price interaction, and invalidation.
**Directional Volume Distribution** — Compares bullish-candle and bearish-candle volume associated with tracked FVGs.
**Session Volatility** — Observes relative ATR conditions during selected session windows.
Together, these components provide a visual framework for examining changes in market structure, gap behavior, candle-volume distribution, and relative volatility.
## Chart Examples
1.
2.
3.
4.
5.
## Important Notice
This indicator is provided for technical analysis and reference purposes only.
All labels, classifications, and visual readings are generated according to the script's predefined calculation rules. They do not guarantee future market behavior or outcomes and should not be treated as standalone confirmation of price direction.
Users should consider broader market conditions and conduct their own independent analysis.
## License
Mozilla Public License 2.0 (MPL-2.0)

Pernyataan Penyangkalan
Informasi dan publikasi ini tidak dimaksudkan, dan bukan merupakan, saran atau rekomendasi keuangan, investasi, trading, atau jenis lainnya yang diberikan atau didukung oleh TradingView. Baca selengkapnya di Ketentuan Penggunaan.
Pernyataan Penyangkalan
Informasi dan publikasi ini tidak dimaksudkan, dan bukan merupakan, saran atau rekomendasi keuangan, investasi, trading, atau jenis lainnya yang diberikan atau didukung oleh TradingView. Baca selengkapnya di Ketentuan Penggunaan.