7AM Fib V7 - FIB Testing Strat
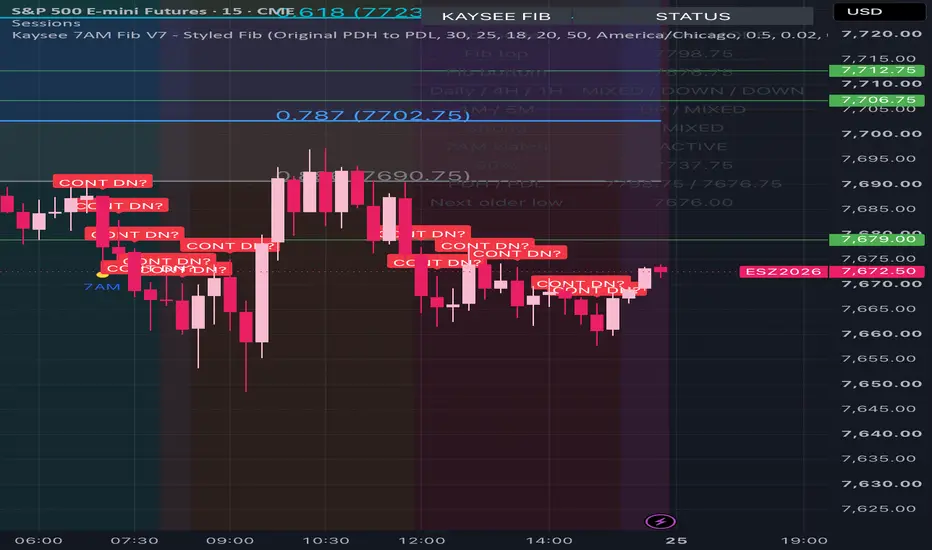
Kaysee 7 AM Fibonacci Trading Rules V6
A custom Fibonacci-based trading indicator designed to identify potential buying opportunities, selling opportunities, trend reversals, and price targets using previous-day price levels and multi-timeframe confirmation.
The Kaysee 7 AM Fibonacci Indicator combines Fibonacci retracements, candlestick behavior, trend analysis, and price action into one charting tool.
Key Features
1. Automatic Fibonacci Levels
Draws Fibonacci levels using the previous day's high and low, including 0, 0.10, 0.236, 0.382, 0.50, 0.618, 0.787, and 0.886.
Features colored horizontal lines, shaded Fibonacci zones, and price labels for easy identification across chart timeframes.
2. Downtrend Fibonacci Adjustment
Allows the Fibonacci range to adjust during bearish conditions by using the previous day's low as the new upper anchor and the next lower historical daily low as the downside target.
Includes automatic and manual Fibonacci modes.
3. 7 AM Trading Setup
Uses the 7 AM trading window to begin monitoring price action on the 15-minute chart for potential buying and selling opportunities.
4. Fibonacci Entry Confirmation
Monitors price movement through the 50% Fibonacci level, potential 40% entry areas, and 61.8% tests to help identify possible trade setups.
5. Candlestick Reversal Detection
Identifies potential buying or selling pressure through rejection wicks, shrinking candlestick bodies, bullish engulfing patterns, and bearish engulfing patterns.
6. Multi-Timeframe Trend Confirmation
Analyzes the Daily, 4-hour, and 1-hour charts using moving averages to identify bullish, bearish, or mixed market conditions.
Additional 1-minute and 5-minute trend checks support short-term continuation analysis.
7. Reversal and Continuation Monitoring
Tracks Fibonacci retests, including returns to the 50% level and additional 0.02/0.03 tests, to identify potential changes in market direction.
8. Price Targets and Exit Alerts
Displays previous-day highs, previous-day lows, and additional historical downside targets. Provides visual signals and selectable alerts when potential trade targets are reached.
Trading Objective
The purpose of this indicator is to help traders develop a structured process for identifying potential entries, recognizing momentum changes, evaluating trend strength, and locating possible exit targets.
Disclaimer: This indicator is intended for educational and analytical purposes only. Signals do not guarantee profitable trades, and the indicator does not automatically execute orders. Backtesting, paper trading, and independent risk management are recommended before live use.
A custom Fibonacci-based trading indicator designed to identify potential buying opportunities, selling opportunities, trend reversals, and price targets using previous-day price levels and multi-timeframe confirmation.
The Kaysee 7 AM Fibonacci Indicator combines Fibonacci retracements, candlestick behavior, trend analysis, and price action into one charting tool.
Key Features
1. Automatic Fibonacci Levels
Draws Fibonacci levels using the previous day's high and low, including 0, 0.10, 0.236, 0.382, 0.50, 0.618, 0.787, and 0.886.
Features colored horizontal lines, shaded Fibonacci zones, and price labels for easy identification across chart timeframes.
2. Downtrend Fibonacci Adjustment
Allows the Fibonacci range to adjust during bearish conditions by using the previous day's low as the new upper anchor and the next lower historical daily low as the downside target.
Includes automatic and manual Fibonacci modes.
3. 7 AM Trading Setup
Uses the 7 AM trading window to begin monitoring price action on the 15-minute chart for potential buying and selling opportunities.
4. Fibonacci Entry Confirmation
Monitors price movement through the 50% Fibonacci level, potential 40% entry areas, and 61.8% tests to help identify possible trade setups.
5. Candlestick Reversal Detection
Identifies potential buying or selling pressure through rejection wicks, shrinking candlestick bodies, bullish engulfing patterns, and bearish engulfing patterns.
6. Multi-Timeframe Trend Confirmation
Analyzes the Daily, 4-hour, and 1-hour charts using moving averages to identify bullish, bearish, or mixed market conditions.
Additional 1-minute and 5-minute trend checks support short-term continuation analysis.
7. Reversal and Continuation Monitoring
Tracks Fibonacci retests, including returns to the 50% level and additional 0.02/0.03 tests, to identify potential changes in market direction.
8. Price Targets and Exit Alerts
Displays previous-day highs, previous-day lows, and additional historical downside targets. Provides visual signals and selectable alerts when potential trade targets are reached.
Trading Objective
The purpose of this indicator is to help traders develop a structured process for identifying potential entries, recognizing momentum changes, evaluating trend strength, and locating possible exit targets.
Disclaimer: This indicator is intended for educational and analytical purposes only. Signals do not guarantee profitable trades, and the indicator does not automatically execute orders. Backtesting, paper trading, and independent risk management are recommended before live use.

Pernyataan Penyangkalan
Informasi dan publikasi ini tidak dimaksudkan, dan bukan merupakan, saran atau rekomendasi keuangan, investasi, trading, atau jenis lainnya yang diberikan atau didukung oleh TradingView. Baca selengkapnya di Ketentuan Penggunaan.
Pernyataan Penyangkalan
Informasi dan publikasi ini tidak dimaksudkan, dan bukan merupakan, saran atau rekomendasi keuangan, investasi, trading, atau jenis lainnya yang diberikan atau didukung oleh TradingView. Baca selengkapnya di Ketentuan Penggunaan.