Diupdate
Volume with Bill Williams Market Facilitation Index Coloring
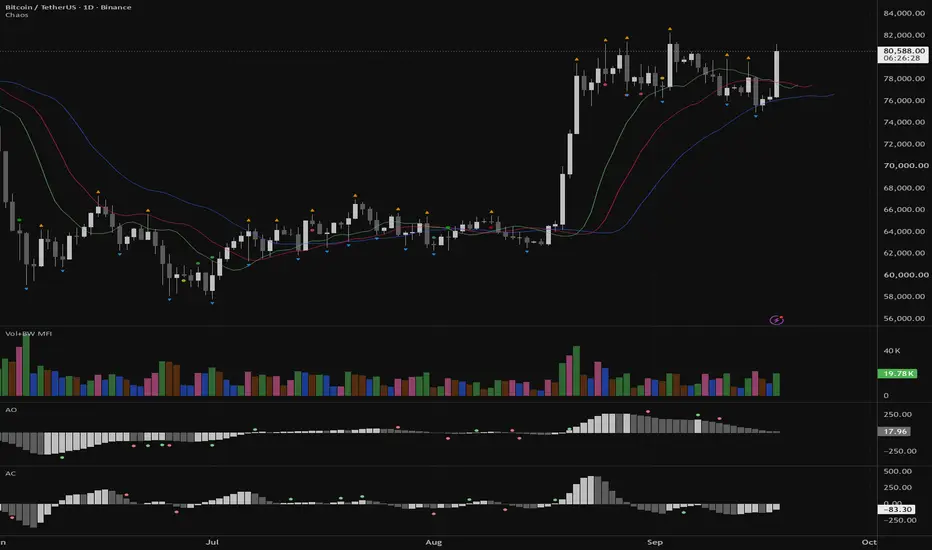
Volume indicator with Bill Williams Market Facilitation Index (BW MFI) coloring.
This indicator applies Bill Williams' BW MFI color logic to volume analysis by comparing price range changes (High-Low) and volume changes.
Market states:
🟢 Green — Range Up + Volume Up
Increasing range and increasing volume indicate strong market activity and participation.
🔵 Blue — Range Up + Volume Down
Price range expands while volume decreases, showing movement with weaker participation.
🩷 Pink — Range Down + Volume Up
Volume increases while price range decreases, indicating a possible battle between buyers and sellers.
🟤 Brown — Range Down + Volume Down
Both range and volume decrease, showing reduced market activity.
Features:
• BW MFI color-based volume analysis
• Optional Volume Moving Average
• Customizable colors
Based on Bill Williams' Market Facilitation Index methodology.
This indicator applies Bill Williams' BW MFI color logic to volume analysis by comparing price range changes (High-Low) and volume changes.
Market states:
🟢 Green — Range Up + Volume Up
Increasing range and increasing volume indicate strong market activity and participation.
🔵 Blue — Range Up + Volume Down
Price range expands while volume decreases, showing movement with weaker participation.
🩷 Pink — Range Down + Volume Up
Volume increases while price range decreases, indicating a possible battle between buyers and sellers.
🟤 Brown — Range Down + Volume Down
Both range and volume decrease, showing reduced market activity.
Features:
• BW MFI color-based volume analysis
• Optional Volume Moving Average
• Customizable colors
Based on Bill Williams' Market Facilitation Index methodology.
Catatan Rilis
Updated the BW MFI calculation and logic.* Uses the classic MFI = (High − Low) / Volume formula.
* Added × 1e12 scaling for reliable comparison of small MFI values.
* MFI direction is determined strictly by comparing the current bar with the previous bar.
* Properly handles cases where MFI or Volume remains unchanged.
* Volume and Volume MA calculations remain unchanged.

Pernyataan Penyangkalan
Informasi dan publikasi ini tidak dimaksudkan, dan bukan merupakan, saran atau rekomendasi keuangan, investasi, trading, atau jenis lainnya yang diberikan atau didukung oleh TradingView. Baca selengkapnya di Ketentuan Penggunaan.
Pernyataan Penyangkalan
Informasi dan publikasi ini tidak dimaksudkan, dan bukan merupakan, saran atau rekomendasi keuangan, investasi, trading, atau jenis lainnya yang diberikan atau didukung oleh TradingView. Baca selengkapnya di Ketentuan Penggunaan.