Apex Effort vs. Result & Absorption
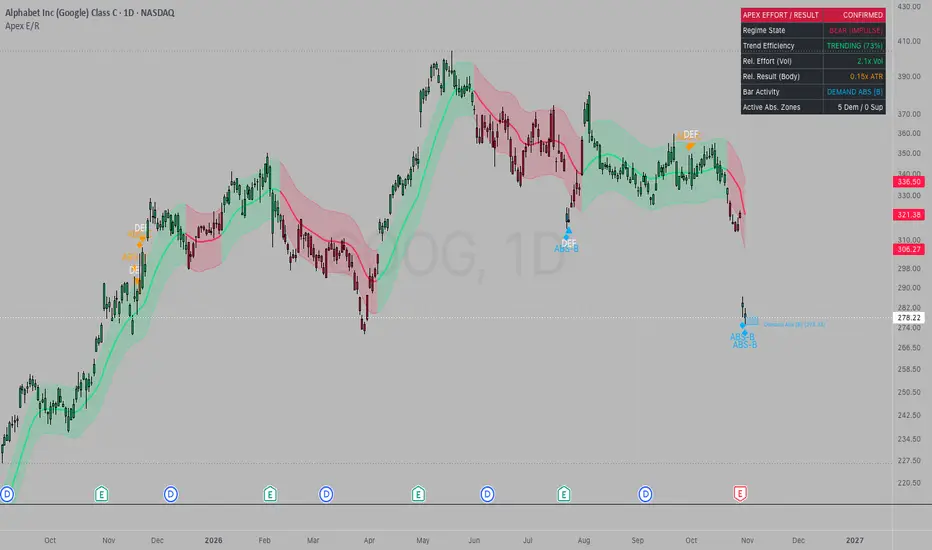
The Apex Effort vs. Result & Absorption indicator is an OHLCV volume-spread analysis (VSA) and market-structure tool inspired by Richard Wyckoff's Third Law: Effort vs. Result.
In liquid markets, net directional displacement (Result) should be proportional to the volume expended (Effort). When an abnormally large surge in volume produces very little net body progress—accompanied by strong wick rejection at a structural extreme—it provides an OHLCV proxy for price absorption (opposing pressure arresting directional movement). Conversely, when high volume produces wide-body directional displacement breaking out of equilibrium, it confirms Initiative Participation.
This script normalizes Effort, Wick-Weighted Result, and Kaufman Fractal Trend Efficiency (KER), classifies anomalies by confluence grade (A, B, C), projects unmitigated Absorption Zones, and tracks subsequent Zone Defense retests on confirmed bar closes.
---
Core Mathematical Architecture
1. Wick-Weighted Effort vs. Result Score
- Relative Effort: Calculated as current bar volume divided by its N-period Simple Moving Average (Default: 20 bars). If a symbol lacks volume data (such as certain Forex pairs or ratio charts), the script automatically switches to a Range-to-ATR proxy and explicitly indicates "Rel. Effort (Range)" in the HUD.
- Relative Body Result: Calculated as net candle body displacement (math.abs(close - open)) divided by the N-period Average True Range (ATR), with a mathematical floor of 0.15 to prevent division by zero on doji candles.
- Wick-Weighted Absorption Score: Rather than treating all small-bodied bars equally, the absorption score weights rejecting wick proportion (Wick / Total Bar Range) directly into the numerator:
* Bullish Score = (Relative Effort * (1 + Lower Wick Ratio)) / Relative Body Result
* Bearish Score = (Relative Effort * (1 + Upper Wick Ratio)) / Relative Body Result
- Signal Quality Grading (ABS-A, ABS-B, ABS-C):
* Grade A: Absorption anomaly aligned with both the established Equilibrium Regime AND Trending Efficiency (KER >= 0.30).
* Grade B: Aligned with either the established Regime OR KER >= 0.30.
* Grade C: Isolated or counter-trend stopping-volume anomaly.
2. Confirmed-Close Signal Engine (Repaint Resistance)
- By default, "Confirm Signals on Bar Close Only" (barstate.isconfirmed) is enabled. Absorption zones, Zone Defense retests (DEF), and Initiative Breakouts (INIT) only lock in when the candle closes, preventing intrabar signal flashing.
- The HUD continues to stream real-time intrabar metrics during an open candle (displaying "LIVE (PROV)" in the header and "PROV. ABSORPTION" if an unclosed bar currently meets criteria) before switching to "CONFIRMED" at bar close.
3. Stateful Absorption Zones & De-Duplicated Retest Defense
- Every confirmed Absorption bar projects a horizontal zone spanning the rejecting wick pocket.
- Zones extend forward until mitigated by a confirmed candle closing strictly below a Demand Absorption low or strictly above a Supply Absorption high.
- Per-Zone Retest Tracking (DEF Triangles): Each active zone tracks its own retest state. By default ("First Defense Only"), a zone triggers a DEF marker only on its first confirmed rejection, eliminating repeated signal clutter across consecutive bars. Users can also select "Fresh Touch After Exit" (which re-arms after price completely leaves the zone) or "All Defenses".
4. Volume-Weighted Efficiency Baseline, KER & Validated Breakouts
- The equilibrium channel combines a Volume-Weighted Moving Average (VWMA) and Hull Moving Average (HMA) surrounded by an ATR band (Default: 34 length, 1.6x ATR).
- Kaufman Efficiency Ratio (KER): Measures net directional travel relative to total bar-to-bar noise over 14 bars, distinguishing efficient trends (>= 40%) from sideways chop (<= 20%).
- Validated Initiative Breakouts (INIT Labels): Triggered when a confirmed directional candle (close > open for bullish, close < open for bearish) closes outside the Equilibrium Channel backed by High Effort (>= 1.4x average volume) and Wide Body Result (>= 1.2x ATR).
---
How to Use This Indicator
- Contextual Setup Framework:
1. Identify the established Regime State in the HUD (Bullish or Bearish) and verify Trend Efficiency (KER).
2. Wait for price to pull back into an unmitigated Demand Absorption Zone (in a Bullish regime) or Supply Absorption Zone (in a Bearish regime).
3. Look for a confirmed DEF triangle indicating that price wicked into the zone and rejected out of it on a closed bar.
- Filtering Noise: Use the "Minimum Absorption Grade" setting to filter for "A & B Only" or "A-Grade Only" if you only wish to see absorption zones that form in alignment with the prevailing regime and efficiency.
---
Disclaimer
This script is an OHLCV-based analytical tool published open-source for educational purposes only. It infers absorption characteristics from price spread and volume rather than direct Level-2/tick order flow, and does not constitute financial advice.

Pernyataan Penyangkalan
Informasi dan publikasi ini tidak dimaksudkan, dan bukan merupakan, saran atau rekomendasi keuangan, investasi, trading, atau jenis lainnya yang diberikan atau didukung oleh TradingView. Baca selengkapnya di Ketentuan Penggunaan.
Pernyataan Penyangkalan
Informasi dan publikasi ini tidak dimaksudkan, dan bukan merupakan, saran atau rekomendasi keuangan, investasi, trading, atau jenis lainnya yang diberikan atau didukung oleh TradingView. Baca selengkapnya di Ketentuan Penggunaan.