OPEN-SOURCE SCRIPT
Liquidity Sweep Detector [SSFX]
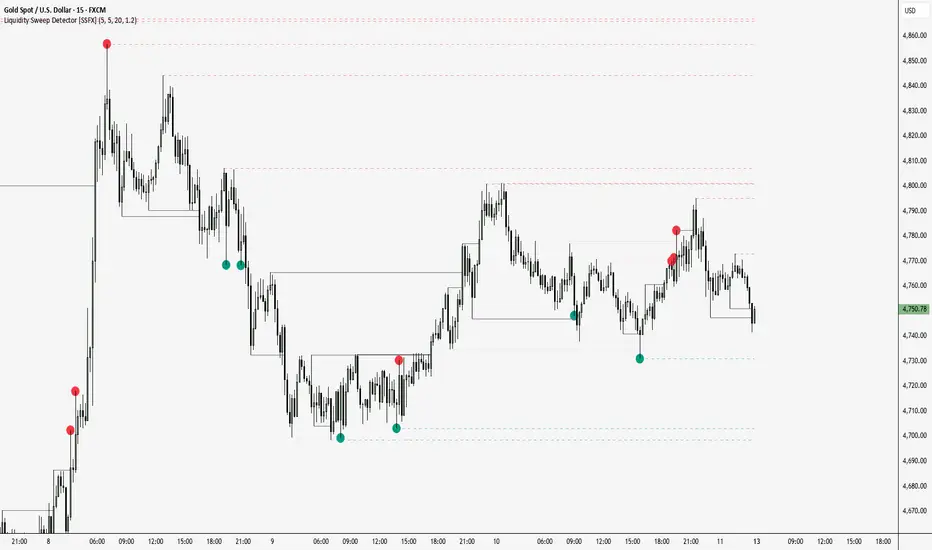
Liquidity Sweep Detector [SSFX] is a price action indicator designed to highlight potential liquidity grabs around confirmed swing highs and swing lows. The script identifies pivot-based levels, tracks them forward on the chart, and detects when price briefly trades beyond those levels with the wick while failing to close through them with the candle body. This behavior is often associated with stop hunts, liquidity sweeps, and rejection-based reversals. The indicator is built to help traders quickly spot these events in a clear and structured way.
The script first builds its framework using pivot highs and pivot lows. Each confirmed pivot becomes a horizontal reference level that remains active until it is either swept or mitigated. A bearish sweep is detected when price pushes above a pivot high with the wick, but the candle body remains below that level. A bullish sweep is detected when price trades below a pivot low with the wick, while the candle body remains above it. This allows the indicator to separate true wick rejections from full body breaks, which is useful for traders who want to focus specifically on liquidity-based price reactions rather than standard support and resistance breaks.
To improve selectivity, the indicator also includes an optional volume filter. When enabled, sweeps are only marked if volume is greater than a configurable moving average threshold multiplied by a user-defined factor. This can help filter out weaker sweeps and emphasize events that occur with stronger market participation. Traders who prefer a cleaner chart can leave the volume filter disabled, while those who want more confirmation can use it to reduce noise.
The script provides clear visual feedback directly on the chart. Active pivot levels are plotted as horizontal dashed lines. When a valid sweep occurs, the indicator draws a colored highlight between the level and the wick extreme, making the rejection area easy to identify. It also places a sweep marker exactly at the wick high or wick low of the sweep candle, rather than simply above or below the bar, which gives more precise visual alignment with the actual liquidity event. Bullish sweeps and bearish sweeps use separate colors so both directions can be distinguished instantly.
In addition to sweep detection, the indicator tracks mitigation events. A mitigation occurs when price breaks a stored pivot level with the candle body rather than merely sweeping it with the wick. When enabled, mitigated levels are recolored and marked with a small cross placed in the middle of the line, helping users differentiate between levels that produced a rejection and levels that were cleanly broken. There is also an option to hide mitigation markings entirely for traders who want the chart to focus only on sweep signals. Historical levels can be preserved or removed after resolution depending on user preference.
This indicator is intended as a visual price action tool, not a complete trading system. It does not generate entries, stop losses, take profits, or strategy performance statistics. Instead, it is designed to support discretionary analysis by helping traders locate areas where liquidity may have been taken and where rejection behavior may be developing. It can be used on its own or combined with higher timeframe structure, supply and demand zones, session context, or confirmation from other price action concepts.
Main features
How to use
Notes
The script first builds its framework using pivot highs and pivot lows. Each confirmed pivot becomes a horizontal reference level that remains active until it is either swept or mitigated. A bearish sweep is detected when price pushes above a pivot high with the wick, but the candle body remains below that level. A bullish sweep is detected when price trades below a pivot low with the wick, while the candle body remains above it. This allows the indicator to separate true wick rejections from full body breaks, which is useful for traders who want to focus specifically on liquidity-based price reactions rather than standard support and resistance breaks.
To improve selectivity, the indicator also includes an optional volume filter. When enabled, sweeps are only marked if volume is greater than a configurable moving average threshold multiplied by a user-defined factor. This can help filter out weaker sweeps and emphasize events that occur with stronger market participation. Traders who prefer a cleaner chart can leave the volume filter disabled, while those who want more confirmation can use it to reduce noise.
The script provides clear visual feedback directly on the chart. Active pivot levels are plotted as horizontal dashed lines. When a valid sweep occurs, the indicator draws a colored highlight between the level and the wick extreme, making the rejection area easy to identify. It also places a sweep marker exactly at the wick high or wick low of the sweep candle, rather than simply above or below the bar, which gives more precise visual alignment with the actual liquidity event. Bullish sweeps and bearish sweeps use separate colors so both directions can be distinguished instantly.
In addition to sweep detection, the indicator tracks mitigation events. A mitigation occurs when price breaks a stored pivot level with the candle body rather than merely sweeping it with the wick. When enabled, mitigated levels are recolored and marked with a small cross placed in the middle of the line, helping users differentiate between levels that produced a rejection and levels that were cleanly broken. There is also an option to hide mitigation markings entirely for traders who want the chart to focus only on sweep signals. Historical levels can be preserved or removed after resolution depending on user preference.
This indicator is intended as a visual price action tool, not a complete trading system. It does not generate entries, stop losses, take profits, or strategy performance statistics. Instead, it is designed to support discretionary analysis by helping traders locate areas where liquidity may have been taken and where rejection behavior may be developing. It can be used on its own or combined with higher timeframe structure, supply and demand zones, session context, or confirmation from other price action concepts.
Main features
- Detects bullish and bearish liquidity sweeps from confirmed pivot levels
- Uses wick-only sweep logic to distinguish sweeps from body breaks
- Optional volume filter for stronger signal selection
- Draws active historical liquidity levels on the chart
- Highlights sweep zones visually with directional coloring
- Places sweep dots exactly at the wick high or wick low
- Marks mitigated levels with a centered cross when enabled
- Includes options to keep or remove historical levels after resolution
- Provides alert conditions for bullish and bearish sweeps
How to use
- Watch for price to wick above a prior high or below a prior low without closing through it
- Use the sweep marker and highlighted zone to quickly confirm the rejection area
- Combine signals with market structure, session timing, or additional confirmation before making trade decisions
- Use the volume filter if you want fewer but more selective sweep signals
Notes
- Pivot-based logic requires right-side confirmation, so signals appear only after the pivot is confirmed
- The script is meant for chart analysis and signal visualization only
- Best used as a supporting tool within a broader trading plan
Skrip open-source
Dengan semangat TradingView yang sesungguhnya, pembuat skrip ini telah menjadikannya sebagai sumber terbuka, sehingga para trader dapat meninjau dan memverifikasi fungsinya. Salut untuk penulisnya! Meskipun Anda dapat menggunakannya secara gratis, perlu diingat bahwa penerbitan ulang kode ini tunduk pada Tata Tertib kami.

Pernyataan Penyangkalan
Informasi dan publikasi ini tidak dimaksudkan, dan bukan merupakan, saran atau rekomendasi keuangan, investasi, trading, atau jenis lainnya yang diberikan atau didukung oleh TradingView. Baca selengkapnya di Ketentuan Penggunaan.
Skrip open-source
Dengan semangat TradingView yang sesungguhnya, pembuat skrip ini telah menjadikannya sebagai sumber terbuka, sehingga para trader dapat meninjau dan memverifikasi fungsinya. Salut untuk penulisnya! Meskipun Anda dapat menggunakannya secara gratis, perlu diingat bahwa penerbitan ulang kode ini tunduk pada Tata Tertib kami.
Pernyataan Penyangkalan
Informasi dan publikasi ini tidak dimaksudkan, dan bukan merupakan, saran atau rekomendasi keuangan, investasi, trading, atau jenis lainnya yang diberikan atau didukung oleh TradingView. Baca selengkapnya di Ketentuan Penggunaan.