Fed Rate Probability
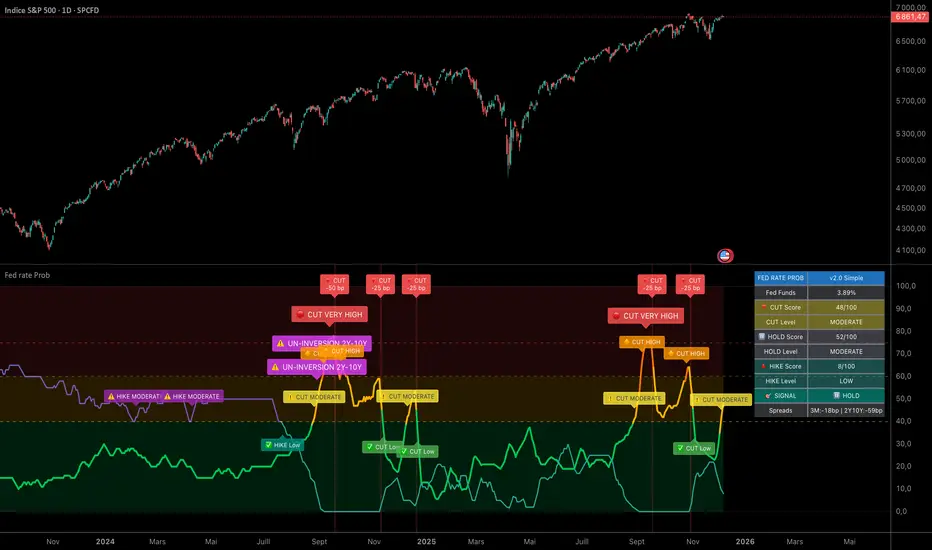
Fed Rate Probability – Simple & Clean v2.0
Real-time composite score (0–100) for the next Fed move: Rate Cut, Hike or Hold
Overview
A clean, all-in-one indicator that combines the most reliable market signals into two easy-to-read lines:
• Red line → Probability of RATE CUT
• Blue line → Probability of RATE HIKE
• Hold score = 100 – max(cut, hike)
The dominant signal (CUT / HOLD / HIKE) is highlighted in the information table.
Key Features
Score Composition (0–100 points)
Interpretation
Why this indicator?
Instead of checking FRED, CME FedWatch, yield curves and T-bill spreads separately, get everything in one pane with a clear, smoothed composite score and instant alerts when the market starts pricing a Fed move aggressively.
Disclaimer
This is a decision-support tool based on historical relationships and current market pricing. It is not financial advice and past performance is no guarantee of future results.
Enjoy and trade safe! 🚀
Real-time composite score (0–100) for the next Fed move: Rate Cut, Hike or Hold
Overview
A clean, all-in-one indicator that combines the most reliable market signals into two easy-to-read lines:
• Red line → Probability of RATE CUT
• Blue line → Probability of RATE HIKE
• Hold score = 100 – max(cut, hike)
The dominant signal (CUT / HOLD / HIKE) is highlighted in the information table.
Key Features
- Automatic daily data from FRED (DFF, 3M/1M/2Y/10Y yields)
- Smart fallback to TradingView native symbols (US01MY, US03MY, US02Y, US10Y) when FRED is unavailable
- Manual CME FedWatch probability override (perfect for weekends/holidays)
- Historical Fed rate cut/hike markers with background shading and labels
- Colored probability zones + customizable threshold lines
- Threshold-crossing labels and full alert suite
- Special alert on 2Y-10Y yield curve un-inversion (strong historical precursor to rate cuts)
- Detailed summary table with current spreads, scores and dominant signal
- Fully customizable: enable/disable each component, adjust weights indirectly via toggles, change smoothing, thresholds, colors, etc.
Score Composition (0–100 points)
- T-bills vs Fed Funds spread – max 50 pts (with persistence & 1M confirmation bonus)
- 2-Year Treasury vs Fed Funds spread – max 30 pts (or direct CME probability input)
- 2Y-10Y yield curve behavior – max 20 pts (inversion depth + large bonus on steepening after un-inversion)
Interpretation
0–40 → Low probability
40–60 → Moderate
60–75 → High
75–100 → Very High / Almost certain
Why this indicator?
Instead of checking FRED, CME FedWatch, yield curves and T-bill spreads separately, get everything in one pane with a clear, smoothed composite score and instant alerts when the market starts pricing a Fed move aggressively.
Disclaimer
This is a decision-support tool based on historical relationships and current market pricing. It is not financial advice and past performance is no guarantee of future results.
Enjoy and trade safe! 🚀

Pernyataan Penyangkalan
Informasi dan publikasi ini tidak dimaksudkan, dan bukan merupakan, saran atau rekomendasi keuangan, investasi, trading, atau jenis lainnya yang diberikan atau didukung oleh TradingView. Baca selengkapnya di Ketentuan Penggunaan.
Pernyataan Penyangkalan
Informasi dan publikasi ini tidak dimaksudkan, dan bukan merupakan, saran atau rekomendasi keuangan, investasi, trading, atau jenis lainnya yang diberikan atau didukung oleh TradingView. Baca selengkapnya di Ketentuan Penggunaan.