OPEN-SOURCE SCRIPT
Diupdate RichmondHillCM - PTJ Regime Change
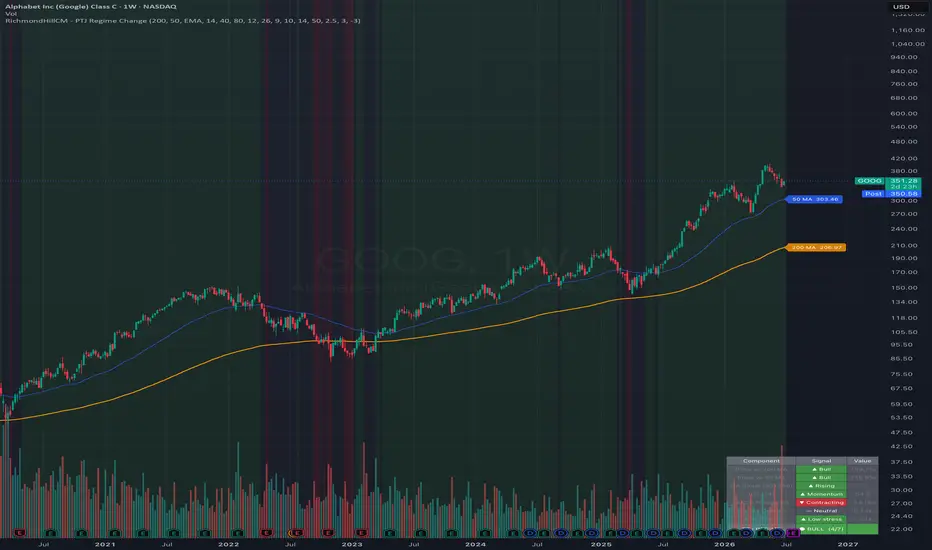
PTJ Regime Change — Bull / Bear / Neutral Market Gauge
A composite market-regime indicator inspired by the trend-following, 200-day-moving-average philosophy popularised by Paul Tudor Jones. Instead of relying on a single signal, it polls seven independent technical components, each casting a +1 (bullish) or −1 (bearish) vote, then sums them into one score from −7 to +7 and classifies the market into a Bull, Bear, or Neutral regime.
The 7 components:
Price vs 200 MA — primary trend filter
Price vs 50 MA — intermediate trend filter
MA slope — are both averages rising?
RSI — momentum inside a healthy band (not weak, not euphoric)
MACD histogram — momentum expanding vs contracting
Volume — does volume confirm the day's direction?
ATR stress — is volatility calm or spiking?
How to use it:
• Background and candle colours show the live regime at a glance.
• The bottom-right table breaks down every component, its signal, and the total score.
• Optional labels mark the exact bar where the regime flips.
• Built-in alerts for regime changes, 200-MA crosses (above/below), and RSI blow-off/euphoria warnings.
Every input is configurable: MA type (SMA/EMA) and lengths, RSI/MACD/ATR settings, volume period, and the bull/bear score thresholds — so you can tune sensitivity to your symbol and timeframe.
Works on any symbol and any timeframe.
Credits: methodology inspired by Paul Tudor Jones' trend/200-MA approach; original scoring framework concept by RichmondHillCM.
Disclaimer: For educational purposes only. This is not financial advice and does not guarantee future performance. Always do your own research.
A composite market-regime indicator inspired by the trend-following, 200-day-moving-average philosophy popularised by Paul Tudor Jones. Instead of relying on a single signal, it polls seven independent technical components, each casting a +1 (bullish) or −1 (bearish) vote, then sums them into one score from −7 to +7 and classifies the market into a Bull, Bear, or Neutral regime.
The 7 components:
Price vs 200 MA — primary trend filter
Price vs 50 MA — intermediate trend filter
MA slope — are both averages rising?
RSI — momentum inside a healthy band (not weak, not euphoric)
MACD histogram — momentum expanding vs contracting
Volume — does volume confirm the day's direction?
ATR stress — is volatility calm or spiking?
How to use it:
• Background and candle colours show the live regime at a glance.
• The bottom-right table breaks down every component, its signal, and the total score.
• Optional labels mark the exact bar where the regime flips.
• Built-in alerts for regime changes, 200-MA crosses (above/below), and RSI blow-off/euphoria warnings.
Every input is configurable: MA type (SMA/EMA) and lengths, RSI/MACD/ATR settings, volume period, and the bull/bear score thresholds — so you can tune sensitivity to your symbol and timeframe.
Works on any symbol and any timeframe.
Credits: methodology inspired by Paul Tudor Jones' trend/200-MA approach; original scoring framework concept by RichmondHillCM.
Disclaimer: For educational purposes only. This is not financial advice and does not guarantee future performance. Always do your own research.
Catatan Rilis
PTJ Regime Change — Bull / Bear / Neutral Market GaugeA composite market-regime indicator inspired by the trend-following, 200-day-moving-average philosophy popularised by Paul Tudor Jones. Instead of relying on a single signal, it polls seven independent technical components, each casting a +1 (bullish) or −1 (bearish) vote, then sums them into one score from −7 to +7 and classifies the market into a Bull, Bear, or Neutral regime.
The 7 components:
Price vs 200 MA — primary trend filter
Price vs 50 MA — intermediate trend filter
MA slope — are both averages rising?
RSI — momentum inside a healthy band (not weak, not euphoric)
MACD histogram — momentum expanding vs contracting
Volume — does volume confirm the day's direction?
ATR stress — is volatility calm or spiking?
How to use it:
• Background and candle colours show the live regime at a glance.
• The bottom-right table breaks down every component, its signal, and the total score.
• Optional labels mark the exact bar where the regime flips.
• Built-in alerts for regime changes, 200-MA crosses (above/below), and RSI blow-off/euphoria warnings.
Every input is configurable: MA type (SMA/EMA) and lengths, RSI/MACD/ATR settings, volume period, and the bull/bear score thresholds — so you can tune sensitivity to your symbol and timeframe.
Works on any symbol and any timeframe.
Credits: methodology inspired by Paul Tudor Jones' trend/200-MA approach; original scoring framework concept by RichmondHillCM.
Disclaimer: For educational purposes only. This is not financial advice and does not guarantee future performance. Always do your own research.
Skrip open-source
Dengan semangat TradingView yang sesungguhnya, pembuat skrip ini telah menjadikannya sebagai sumber terbuka, sehingga para trader dapat meninjau dan memverifikasi fungsinya. Salut untuk penulisnya! Meskipun Anda dapat menggunakannya secara gratis, perlu diingat bahwa penerbitan ulang kode ini tunduk pada Tata Tertib kami.

Pernyataan Penyangkalan
Informasi dan publikasi ini tidak dimaksudkan, dan bukan merupakan, saran atau rekomendasi keuangan, investasi, trading, atau jenis lainnya yang diberikan atau didukung oleh TradingView. Baca selengkapnya di Ketentuan Penggunaan.
Skrip open-source
Dengan semangat TradingView yang sesungguhnya, pembuat skrip ini telah menjadikannya sebagai sumber terbuka, sehingga para trader dapat meninjau dan memverifikasi fungsinya. Salut untuk penulisnya! Meskipun Anda dapat menggunakannya secara gratis, perlu diingat bahwa penerbitan ulang kode ini tunduk pada Tata Tertib kami.
Pernyataan Penyangkalan
Informasi dan publikasi ini tidak dimaksudkan, dan bukan merupakan, saran atau rekomendasi keuangan, investasi, trading, atau jenis lainnya yang diberikan atau didukung oleh TradingView. Baca selengkapnya di Ketentuan Penggunaan.