OPEN-SOURCE SCRIPT
Fear & Greed Index
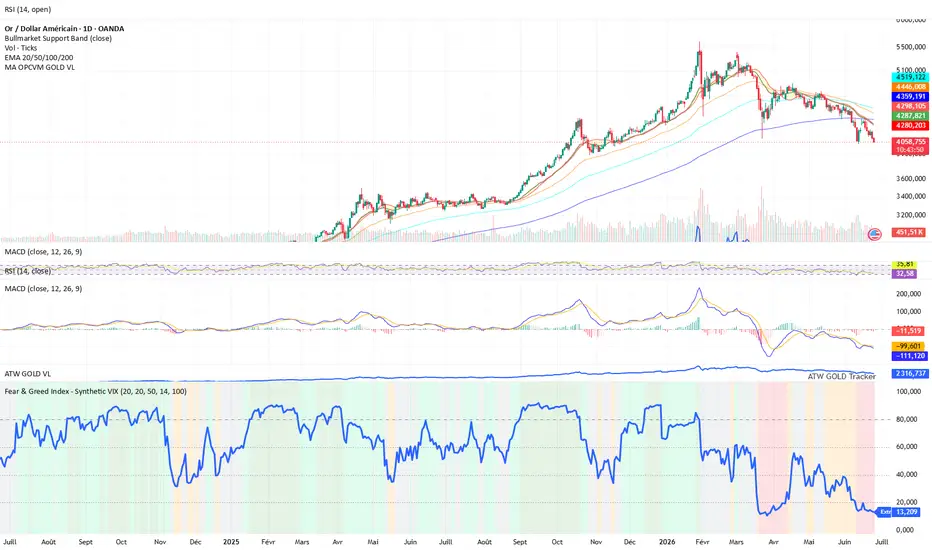
The Fear & Greed Index is a synthetic market sentiment indicator designed to convert multiple technical signals into a single 0–100 score.
Its purpose is to quickly identify market phases of fear, neutrality, or greed across any asset or index.
This indicator does not rely on an official VIX.
Instead, it uses synthetic realized volatility, combined with trend and momentum metrics, to provide a visual reading of market sentiment and regime conditions.
Methodology
The score is built from several components:
Realized volatility
used as a market stress proxy: higher volatility pushes the index toward fear.
Momentum
captures recent price acceleration or deterioration.
RSI
evaluates market strength and overbought / oversold conditions.
Trend vs moving average
compares current price to its moving average to assess directional bias.
Drawdown
measures the distance from recent highs to identify stress, correction, or recovery phases.
Score interpretation
The final score is normalized between 0 and 100:
0 – 20 → Extreme Fear
20 – 40 → Fear
40 – 60 → Neutral
60 – 80 → Greed
80 – 100 → Extreme Greed
How to use it
Low readings usually reflect stressed, volatile, or corrective market conditions.
High readings usually reflect confident, bullish, or potentially overheated market conditions.
The indicator is best used as a market regime / sentiment filter, not as a standalone buy or sell signal.
Disclaimer
This script is a synthetic sentiment indicator based on price and volume data.
It is not an official volatility index and should not be considered investment advice.
Its purpose is to quickly identify market phases of fear, neutrality, or greed across any asset or index.
This indicator does not rely on an official VIX.
Instead, it uses synthetic realized volatility, combined with trend and momentum metrics, to provide a visual reading of market sentiment and regime conditions.
Methodology
The score is built from several components:
Realized volatility
used as a market stress proxy: higher volatility pushes the index toward fear.
Momentum
captures recent price acceleration or deterioration.
RSI
evaluates market strength and overbought / oversold conditions.
Trend vs moving average
compares current price to its moving average to assess directional bias.
Drawdown
measures the distance from recent highs to identify stress, correction, or recovery phases.
Score interpretation
The final score is normalized between 0 and 100:
0 – 20 → Extreme Fear
20 – 40 → Fear
40 – 60 → Neutral
60 – 80 → Greed
80 – 100 → Extreme Greed
How to use it
Low readings usually reflect stressed, volatile, or corrective market conditions.
High readings usually reflect confident, bullish, or potentially overheated market conditions.
The indicator is best used as a market regime / sentiment filter, not as a standalone buy or sell signal.
Disclaimer
This script is a synthetic sentiment indicator based on price and volume data.
It is not an official volatility index and should not be considered investment advice.
Skrip open-source
Dengan semangat TradingView yang sesungguhnya, pembuat skrip ini telah menjadikannya sebagai sumber terbuka, sehingga para trader dapat meninjau dan memverifikasi fungsinya. Salut untuk penulisnya! Meskipun Anda dapat menggunakannya secara gratis, perlu diingat bahwa penerbitan ulang kode ini tunduk pada Tata Tertib kami.

Pernyataan Penyangkalan
Informasi dan publikasi ini tidak dimaksudkan, dan bukan merupakan, saran atau rekomendasi keuangan, investasi, trading, atau jenis lainnya yang diberikan atau didukung oleh TradingView. Baca selengkapnya di Ketentuan Penggunaan.
Skrip open-source
Dengan semangat TradingView yang sesungguhnya, pembuat skrip ini telah menjadikannya sebagai sumber terbuka, sehingga para trader dapat meninjau dan memverifikasi fungsinya. Salut untuk penulisnya! Meskipun Anda dapat menggunakannya secara gratis, perlu diingat bahwa penerbitan ulang kode ini tunduk pada Tata Tertib kami.
Pernyataan Penyangkalan
Informasi dan publikasi ini tidak dimaksudkan, dan bukan merupakan, saran atau rekomendasi keuangan, investasi, trading, atau jenis lainnya yang diberikan atau didukung oleh TradingView. Baca selengkapnya di Ketentuan Penggunaan.