ATK/DEF Quant ICT Timeframe Piggy Score
# ATK/DEF Quant ICT Timeframe Piggy Score
### Multi-Timeframe Quantitative Market Analysis & Buy/Sell Signal Monitoring System
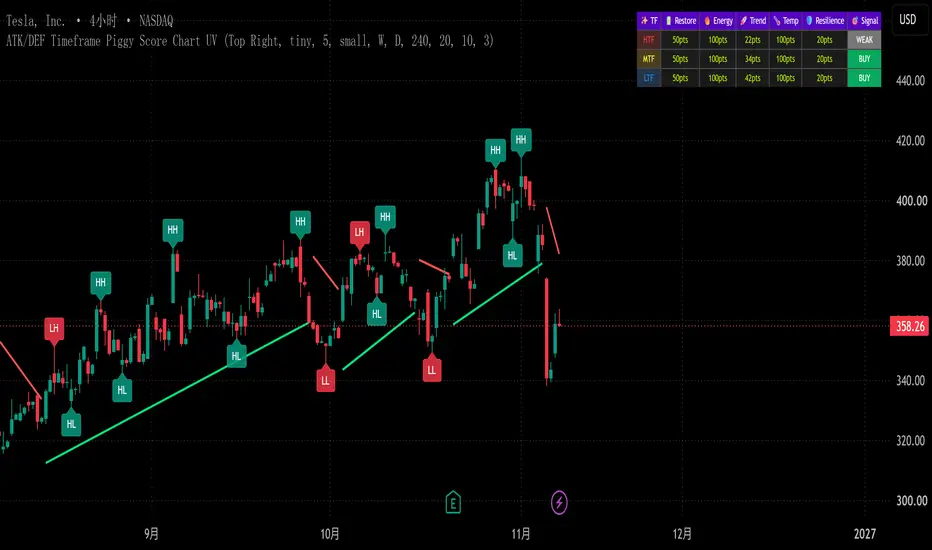
ATK/DEF Quant ICT Timeframe Piggy Score is a multi-timeframe quantitative market analysis indicator designed to monitor market structure, momentum, volatility, trend strength, price deviation, and market conditions.
The system integrates Higher Timeframe (HTF), Medium Timeframe (MTF), and Lower Timeframe (LTF) analysis into a unified quantitative dashboard.
By combining five statistical scoring components with swing structure identification, Supertrend direction, and multi-timeframe price range monitoring, the indicator provides a consolidated view of market conditions and predefined buy/sell signal classifications.
## Core Modules
**1. Quantitative Command Dashboard**
- Restore Score
- Energy Score
- Trend Strength Score
- Temperature Score
- Resilience Score
- Composite Score Calculation
- Six-Level Buy/Sell Signal Classification
- HTF / MTF / LTF Score Comparison
**2. Multi-Timeframe Analysis**
- Higher Timeframe (HTF)
- Medium Timeframe (MTF)
- Lower Timeframe (LTF)
- Configurable Timeframe Selection
- Multi-Timeframe High / Low Monitoring
- Price Distance Percentage
- Range Extension Visualization
**3. Market Structure Intelligence**
- Higher High (HH)
- Higher Low (HL)
- Lower High (LH)
- Lower Low (LL)
- Swing High / Low Classification
- Bullish / Bearish Structure Visualization
**4. Momentum & Trend Analysis**
- RSI (14)
- ADX (14,14)
- Supertrend Direction
- Trend Transition Markers
- Consecutive Candle Measurement
**5. ATR Volatility & Energy Measurement**
- ATR (14)
- Relative Volatility Calculation
- Normalized Energy Score
- Price Deviation Measurement
- Dynamic Market Condition Monitoring
**6. Multi-Timeframe Range Monitoring**
- HTF High / Low Boundaries
- MTF High / Low Boundaries
- LTF High / Low Boundaries
- Range Extension Lines
- Percentage-Based Price Distance
- PB Condition Markers
- Price Boundary Monitoring
**7. Breakout Alert Monitoring**
- HTF High Breakout Alert
- HTF Low Breakdown Alert
- MTF High Breakout Alert
- MTF Low Breakdown Alert
- LTF High Breakout Alert
- LTF Low Breakdown Alert
## Quantitative Scoring Architecture
The composite score consists of five equally weighted calculation components.
**Restore Score**
An RSI-based measurement using RSI (14), with specific calculations for extreme RSI conditions and distance from the midpoint.
**Energy Score**
A normalized volatility measurement calculated from ATR (14) relative to the current price.
**Trend Score**
An ADX-based measurement representing calculated trend strength.
**Temperature Score**
Measures the absolute percentage deviation between the current price and its 20-period Simple Moving Average (SMA).
**Resilience Score**
Measures consecutive bullish or bearish candle behavior, with the result normalized to a maximum of 100 points.
**Composite Score**
The five component scores are combined through an arithmetic average to produce the final composite score.
Each component contributes equally to the overall calculation.
The HTF, MTF, and LTF dashboards display their respective composite score readings and signal classifications.
## Buy / Sell Signal Classification
The indicator generates six predefined signal classifications based on composite score thresholds.
**STRONG BUY**
- Composite Score above 75.
**BUY**
- Composite Score above 60 and up to 75.
**WEAK**
- Composite Score above 50 and up to 60.
**WAIT**
- Composite Score from 40 to 50.
**SELL**
- Composite Score from 25 to below 40.
**STRONG SELL**
- Composite Score below 25.
Each timeframe generates its own classification according to its calculated composite score.
The signal classifications are produced by programmed mathematical conditions using the five quantitative scoring components.
They represent the indicator's calculated market condition outputs and are not independent confirmations of bullish or bearish price direction.
## Supertrend Direction Monitoring
The Supertrend module provides a separate trend-direction reference based on configurable ATR settings.
It displays:
- Bullish Supertrend Direction
- Bearish Supertrend Direction
- Trend Transition Markers
- Dynamic Supertrend Line Visualization
Break labels identify changes in Supertrend direction.
## Swing Structure Monitoring
The swing module identifies confirmed pivot formations and classifies them into:
- HH — Higher High
- HL — Higher Low
- LH — Lower High
- LL — Lower Low
Swing classifications provide additional price-structure context alongside the quantitative dashboard.
## Multi-Timeframe Price Range Analysis
The range module monitors the High and Low values of three configurable timeframes.
HTF, MTF, and LTF reference levels are displayed independently with dedicated colors and horizontal extension lines.
The indicator also calculates percentage distances between the current chart price and the corresponding timeframe boundaries.
These measurements provide a comparative view of price positioning across multiple timeframe ranges.
## Price Boundary & Breakout Alerts
The alert module monitors price crossings above or below the selected timeframe High / Low reference levels.
Available alert conditions include:
- HTF High Breakout
- HTF Low Breakdown
- MTF High Breakout
- MTF Low Breakdown
- LTF High Breakout
- LTF Low Breakdown
Alerts are generated when the programmed price-boundary crossing conditions are satisfied.
## Chart Examples & Visual References
The following chart examples illustrate the indicator's quantitative dashboard, multi-timeframe score classifications, swing structure, Supertrend transitions, price boundaries, and different market conditions.
**01 — Swing Structure Classification**

**02 — Multi-Timeframe Buy/Sell Signal Dashboard**

**03 — Composite Quantitative Market Conditions**

**04 — WAIT and Low-Score Conditions**

**05 — Multi-Timeframe OHLC Range Visualization**

**06 — HTF / MTF / LTF Timeframe Comparison**

**07 — Multi-Timeframe Market Condition Scenarios**

**08 — Price Range Boundaries & PB Markers**

**09 — Supertrend Direction & Transition Monitoring**

**10 — Composite Score & Market Condition Visualization**

**11 — Integrated Quantitative Dashboard**

## Calculation Characteristics & Data Limitations
- Multi-timeframe calculations use TradingView's request.security() function with barmerge.lookahead_off.
- Higher-timeframe values may fluctuate before their respective candles are confirmed.
- Swing pivot classifications require the configured right-side confirmation bars.
- The Resilience component currently measures consecutive candles on the active chart timeframe.
- Supertrend Break markers represent Supertrend direction transitions, not independent BOS or CHoCH confirmations.
- PB markers are generated from predefined price and candle conditions.
- Composite scores represent normalized statistical measurements and do not independently confirm market direction.
- The indicator does not directly calculate actual order-book liquidity, institutional order flow, or complete ICT execution models.
- Historical chart displays should be interpreted in the context of the indicator's calculation settings and timeframe data.
## Signal Usage & Disclaimer
ATK/DEF Quant ICT Timeframe Piggy Score is designed for quantitative market analysis, multi-timeframe monitoring, and programmed buy/sell signal classification.
All displayed signals, scores, labels, and visual markers are generated through predefined mathematical calculations and indicator conditions.
The BUY and SELL classifications represent composite quantitative score levels and should not be interpreted as guaranteed predictions of future price direction or automatic trade execution instructions.
### Multi-Timeframe Quantitative Market Analysis & Buy/Sell Signal Monitoring System
ATK/DEF Quant ICT Timeframe Piggy Score is a multi-timeframe quantitative market analysis indicator designed to monitor market structure, momentum, volatility, trend strength, price deviation, and market conditions.
The system integrates Higher Timeframe (HTF), Medium Timeframe (MTF), and Lower Timeframe (LTF) analysis into a unified quantitative dashboard.
By combining five statistical scoring components with swing structure identification, Supertrend direction, and multi-timeframe price range monitoring, the indicator provides a consolidated view of market conditions and predefined buy/sell signal classifications.
## Core Modules
**1. Quantitative Command Dashboard**
- Restore Score
- Energy Score
- Trend Strength Score
- Temperature Score
- Resilience Score
- Composite Score Calculation
- Six-Level Buy/Sell Signal Classification
- HTF / MTF / LTF Score Comparison
**2. Multi-Timeframe Analysis**
- Higher Timeframe (HTF)
- Medium Timeframe (MTF)
- Lower Timeframe (LTF)
- Configurable Timeframe Selection
- Multi-Timeframe High / Low Monitoring
- Price Distance Percentage
- Range Extension Visualization
**3. Market Structure Intelligence**
- Higher High (HH)
- Higher Low (HL)
- Lower High (LH)
- Lower Low (LL)
- Swing High / Low Classification
- Bullish / Bearish Structure Visualization
**4. Momentum & Trend Analysis**
- RSI (14)
- ADX (14,14)
- Supertrend Direction
- Trend Transition Markers
- Consecutive Candle Measurement
**5. ATR Volatility & Energy Measurement**
- ATR (14)
- Relative Volatility Calculation
- Normalized Energy Score
- Price Deviation Measurement
- Dynamic Market Condition Monitoring
**6. Multi-Timeframe Range Monitoring**
- HTF High / Low Boundaries
- MTF High / Low Boundaries
- LTF High / Low Boundaries
- Range Extension Lines
- Percentage-Based Price Distance
- PB Condition Markers
- Price Boundary Monitoring
**7. Breakout Alert Monitoring**
- HTF High Breakout Alert
- HTF Low Breakdown Alert
- MTF High Breakout Alert
- MTF Low Breakdown Alert
- LTF High Breakout Alert
- LTF Low Breakdown Alert
## Quantitative Scoring Architecture
The composite score consists of five equally weighted calculation components.
**Restore Score**
An RSI-based measurement using RSI (14), with specific calculations for extreme RSI conditions and distance from the midpoint.
**Energy Score**
A normalized volatility measurement calculated from ATR (14) relative to the current price.
**Trend Score**
An ADX-based measurement representing calculated trend strength.
**Temperature Score**
Measures the absolute percentage deviation between the current price and its 20-period Simple Moving Average (SMA).
**Resilience Score**
Measures consecutive bullish or bearish candle behavior, with the result normalized to a maximum of 100 points.
**Composite Score**
The five component scores are combined through an arithmetic average to produce the final composite score.
Each component contributes equally to the overall calculation.
The HTF, MTF, and LTF dashboards display their respective composite score readings and signal classifications.
## Buy / Sell Signal Classification
The indicator generates six predefined signal classifications based on composite score thresholds.
**STRONG BUY**
- Composite Score above 75.
**BUY**
- Composite Score above 60 and up to 75.
**WEAK**
- Composite Score above 50 and up to 60.
**WAIT**
- Composite Score from 40 to 50.
**SELL**
- Composite Score from 25 to below 40.
**STRONG SELL**
- Composite Score below 25.
Each timeframe generates its own classification according to its calculated composite score.
The signal classifications are produced by programmed mathematical conditions using the five quantitative scoring components.
They represent the indicator's calculated market condition outputs and are not independent confirmations of bullish or bearish price direction.
## Supertrend Direction Monitoring
The Supertrend module provides a separate trend-direction reference based on configurable ATR settings.
It displays:
- Bullish Supertrend Direction
- Bearish Supertrend Direction
- Trend Transition Markers
- Dynamic Supertrend Line Visualization
Break labels identify changes in Supertrend direction.
## Swing Structure Monitoring
The swing module identifies confirmed pivot formations and classifies them into:
- HH — Higher High
- HL — Higher Low
- LH — Lower High
- LL — Lower Low
Swing classifications provide additional price-structure context alongside the quantitative dashboard.
## Multi-Timeframe Price Range Analysis
The range module monitors the High and Low values of three configurable timeframes.
HTF, MTF, and LTF reference levels are displayed independently with dedicated colors and horizontal extension lines.
The indicator also calculates percentage distances between the current chart price and the corresponding timeframe boundaries.
These measurements provide a comparative view of price positioning across multiple timeframe ranges.
## Price Boundary & Breakout Alerts
The alert module monitors price crossings above or below the selected timeframe High / Low reference levels.
Available alert conditions include:
- HTF High Breakout
- HTF Low Breakdown
- MTF High Breakout
- MTF Low Breakdown
- LTF High Breakout
- LTF Low Breakdown
Alerts are generated when the programmed price-boundary crossing conditions are satisfied.
## Chart Examples & Visual References
The following chart examples illustrate the indicator's quantitative dashboard, multi-timeframe score classifications, swing structure, Supertrend transitions, price boundaries, and different market conditions.
**01 — Swing Structure Classification**
**02 — Multi-Timeframe Buy/Sell Signal Dashboard**
**03 — Composite Quantitative Market Conditions**
**04 — WAIT and Low-Score Conditions**
**05 — Multi-Timeframe OHLC Range Visualization**
**06 — HTF / MTF / LTF Timeframe Comparison**
**07 — Multi-Timeframe Market Condition Scenarios**
**08 — Price Range Boundaries & PB Markers**
**09 — Supertrend Direction & Transition Monitoring**
**10 — Composite Score & Market Condition Visualization**
**11 — Integrated Quantitative Dashboard**
## Calculation Characteristics & Data Limitations
- Multi-timeframe calculations use TradingView's request.security() function with barmerge.lookahead_off.
- Higher-timeframe values may fluctuate before their respective candles are confirmed.
- Swing pivot classifications require the configured right-side confirmation bars.
- The Resilience component currently measures consecutive candles on the active chart timeframe.
- Supertrend Break markers represent Supertrend direction transitions, not independent BOS or CHoCH confirmations.
- PB markers are generated from predefined price and candle conditions.
- Composite scores represent normalized statistical measurements and do not independently confirm market direction.
- The indicator does not directly calculate actual order-book liquidity, institutional order flow, or complete ICT execution models.
- Historical chart displays should be interpreted in the context of the indicator's calculation settings and timeframe data.
## Signal Usage & Disclaimer
ATK/DEF Quant ICT Timeframe Piggy Score is designed for quantitative market analysis, multi-timeframe monitoring, and programmed buy/sell signal classification.
All displayed signals, scores, labels, and visual markers are generated through predefined mathematical calculations and indicator conditions.
The BUY and SELL classifications represent composite quantitative score levels and should not be interpreted as guaranteed predictions of future price direction or automatic trade execution instructions.

Pernyataan Penyangkalan
Informasi dan publikasi ini tidak dimaksudkan, dan bukan merupakan, saran atau rekomendasi keuangan, investasi, trading, atau jenis lainnya yang diberikan atau didukung oleh TradingView. Baca selengkapnya di Ketentuan Penggunaan.
Pernyataan Penyangkalan
Informasi dan publikasi ini tidak dimaksudkan, dan bukan merupakan, saran atau rekomendasi keuangan, investasi, trading, atau jenis lainnya yang diberikan atau didukung oleh TradingView. Baca selengkapnya di Ketentuan Penggunaan.