Inverse Volatility Allocation | NickJoan
Inverse Volatility Allocation | NickJoan
Core Idea
Inverse Volatility Allocation calculates how a portfolio could be weighted across a selected group of assets, based on each asset's recent volatility.
Assets with lower volatility receive larger weights, and assets with higher volatility receive smaller weights. The result is a simple risk-based allocation in which each asset contributes less unequal risk than it would under equal weighting.
The indicator is useful for studying:
• Risk-based portfolio construction.
• Volatility comparison across assets.
• Diversification.
• Allocation rebalancing ideas.
• Risk management.
Calculation Logic
The indicator works through four steps:
1. Log returns
For each selected asset, the script calculates the one-bar logarithmic return:
• Return: log(current close / previous close)
2. Volatility
The script calculates the standard deviation of these returns over the selected lookback period. Each asset is measured on its own trading bars, so the lookback counts that asset's own bars.
3. Annualization
Volatility can be shown as:
• None: raw per-bar volatility.
• Crypto: annualized with √365.
• Traditional: annualized with √252.
Annualization changes the displayed volatility only. It applies equally to every asset, so it does not change the allocation percentages.
4. Inverse volatility weights
Each asset's inverse volatility is calculated as:
• Inverse volatility = 1 / volatility
Each weight is then normalized so that all weights add up to 100%:
• Allocation = asset inverse volatility / sum of all inverse volatilities
Example
Three assets with volatilities of 40%, 60%, and 80%:
• Asset A: inverse 0.02500, allocation 46.15%.
• Asset B: inverse 0.01667, allocation 30.77%.
• Asset C: inverse 0.01250, allocation 23.08%.
Chart Output
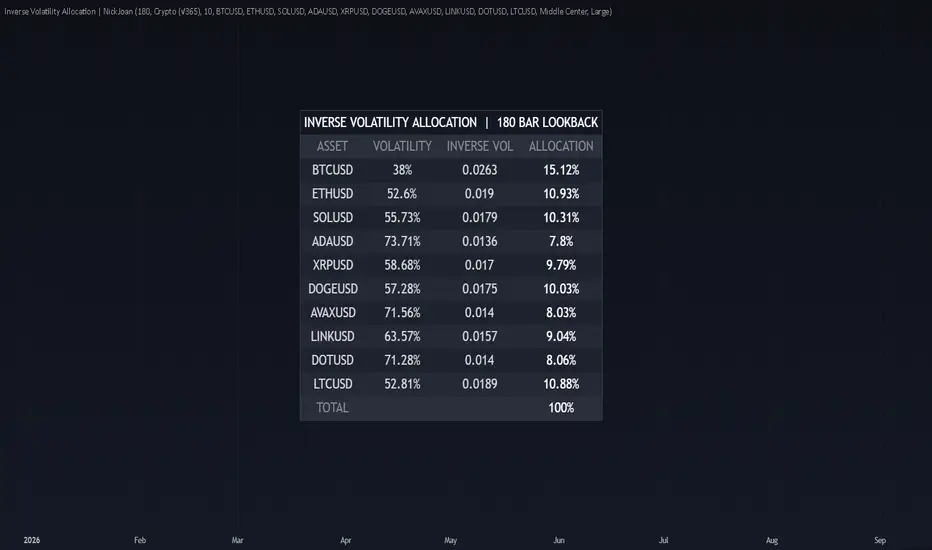
The indicator displays a table with:
• Asset ticker.
• Volatility.
• Inverse volatility.
• Allocation percentage.
• Total allocation.
Inputs
Volatility Lookback
Number of bars used to calculate volatility. Shorter lengths react faster but are noisier. Longer lengths are smoother but slower to adapt.
Annualization
None, Crypto (√365), or Traditional (√252).
Number of Assets
Select 2 to 10 assets to include in the allocation.
Asset 1 to Asset 10
The symbols used in the calculation. Only the first selected number of assets is included.
Table Position and Text Size
Controls where the table appears and how large it is.
Notes and Caveats
• Annualization changes only the displayed volatility, not the allocation percentages, because the same factor applies to every asset.
• Annualization assumes daily bars. On other timeframes the annualized figure is not a true annual volatility.
• Mixing crypto and traditional assets with a single annualization factor makes the displayed volatilities slightly inconsistent, but the weights are unaffected.
• The indicator uses the population standard deviation. This does not change the weights, because it affects every asset equally.
• Inverse volatility weighting does not account for correlation between assets. Highly correlated assets still each receive their own weight.
• Values are based on the most recent bar, including the unfinished one, so the table updates live on an active chart.
• Assets with missing or zero volatility, or with less history than the lookback, are excluded. They show N/A with a 0% allocation until enough data is available.
• Volatility is based on past data and does not predict future volatility.
• Results can change significantly across lookback lengths, timeframes, market regimes, and data providers.
• A wrong or illiquid symbol can skew the weights, so check that every selected asset shows real values.
• This indicator is for educational and analytical purposes only and is not financial advice.
For the most meaningful comparison, use assets with similar trading calendars, timeframes, and data quality.
Core Idea
Inverse Volatility Allocation calculates how a portfolio could be weighted across a selected group of assets, based on each asset's recent volatility.
Assets with lower volatility receive larger weights, and assets with higher volatility receive smaller weights. The result is a simple risk-based allocation in which each asset contributes less unequal risk than it would under equal weighting.
The indicator is useful for studying:
• Risk-based portfolio construction.
• Volatility comparison across assets.
• Diversification.
• Allocation rebalancing ideas.
• Risk management.
Calculation Logic
The indicator works through four steps:
1. Log returns
For each selected asset, the script calculates the one-bar logarithmic return:
• Return: log(current close / previous close)
2. Volatility
The script calculates the standard deviation of these returns over the selected lookback period. Each asset is measured on its own trading bars, so the lookback counts that asset's own bars.
3. Annualization
Volatility can be shown as:
• None: raw per-bar volatility.
• Crypto: annualized with √365.
• Traditional: annualized with √252.
Annualization changes the displayed volatility only. It applies equally to every asset, so it does not change the allocation percentages.
4. Inverse volatility weights
Each asset's inverse volatility is calculated as:
• Inverse volatility = 1 / volatility
Each weight is then normalized so that all weights add up to 100%:
• Allocation = asset inverse volatility / sum of all inverse volatilities
Example
Three assets with volatilities of 40%, 60%, and 80%:
• Asset A: inverse 0.02500, allocation 46.15%.
• Asset B: inverse 0.01667, allocation 30.77%.
• Asset C: inverse 0.01250, allocation 23.08%.
Chart Output
The indicator displays a table with:
• Asset ticker.
• Volatility.
• Inverse volatility.
• Allocation percentage.
• Total allocation.
Inputs
Volatility Lookback
Number of bars used to calculate volatility. Shorter lengths react faster but are noisier. Longer lengths are smoother but slower to adapt.
Annualization
None, Crypto (√365), or Traditional (√252).
Number of Assets
Select 2 to 10 assets to include in the allocation.
Asset 1 to Asset 10
The symbols used in the calculation. Only the first selected number of assets is included.
Table Position and Text Size
Controls where the table appears and how large it is.
Notes and Caveats
• Annualization changes only the displayed volatility, not the allocation percentages, because the same factor applies to every asset.
• Annualization assumes daily bars. On other timeframes the annualized figure is not a true annual volatility.
• Mixing crypto and traditional assets with a single annualization factor makes the displayed volatilities slightly inconsistent, but the weights are unaffected.
• The indicator uses the population standard deviation. This does not change the weights, because it affects every asset equally.
• Inverse volatility weighting does not account for correlation between assets. Highly correlated assets still each receive their own weight.
• Values are based on the most recent bar, including the unfinished one, so the table updates live on an active chart.
• Assets with missing or zero volatility, or with less history than the lookback, are excluded. They show N/A with a 0% allocation until enough data is available.
• Volatility is based on past data and does not predict future volatility.
• Results can change significantly across lookback lengths, timeframes, market regimes, and data providers.
• A wrong or illiquid symbol can skew the weights, so check that every selected asset shows real values.
• This indicator is for educational and analytical purposes only and is not financial advice.
For the most meaningful comparison, use assets with similar trading calendars, timeframes, and data quality.

Pernyataan Penyangkalan
Informasi dan publikasi ini tidak dimaksudkan, dan bukan merupakan, saran atau rekomendasi keuangan, investasi, trading, atau jenis lainnya yang diberikan atau didukung oleh TradingView. Baca selengkapnya di Ketentuan Penggunaan.
Pernyataan Penyangkalan
Informasi dan publikasi ini tidak dimaksudkan, dan bukan merupakan, saran atau rekomendasi keuangan, investasi, trading, atau jenis lainnya yang diberikan atau didukung oleh TradingView. Baca selengkapnya di Ketentuan Penggunaan.