OPEN-SOURCE SCRIPT
Diupdate Quantum Dynamic Mitigation Zones v1
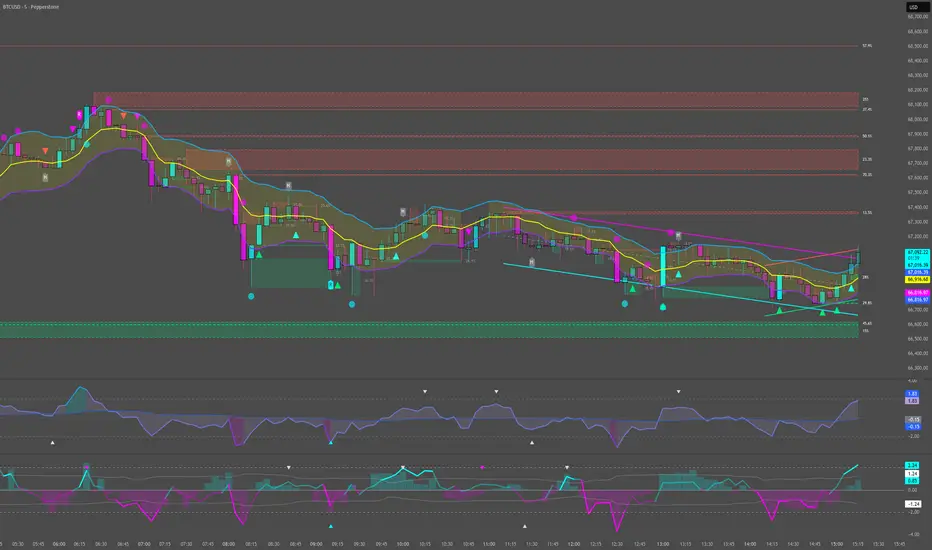
Quantum Dynamic Mitigation Zones - Institutional Order Flow Support/Resistance
Overview
Traditional Support and Resistance lines rely on lagging historical pivots. The Quantum Dynamic Mitigation Zones indicator brings true institutional order flow to your charts. It scans for massive, statistically significant volume anomalies (Whale executions) and draws rigid Supply and Demand zones forward in time. Most importantly, it visually simulates order book "Mitigation"—as price wicks back into these zones, the boxes physically shrink, showing you exactly how much institutional liquidity has been "eaten" before the level finally breaks.
Key Highlights
• Anomaly Detection: Scans the current timeframe for extreme volume spikes (e.g., 300%+ above the moving average) to identify where institutional money stepped in.
• Dynamic Mitigation Engine: As future price action retraces into a drawn zone, the script permanently erases the portion of the box that price touched.
• Visual Liquidity: Instead of guessing if a level is still strong, you can literally see if the box is wide and heavily defended, or if it has been reduced to a thin sliver about to break.
How to Trade It
When an anomaly zone is first created, do not chase the breakout. Wait for price to naturally retrace back to the box. If the price taps the edge of the box and rejects strongly, buy/sell the bounce. If price begins heavily "eating" into the box, narrowing its size, assume the institutional defense is depleted and prepare to trade the continuation breakout through the zone.
⚠️ DISCLAIMER: STRICTLY FOR EDUCATIONAL PURPOSES
The information, scripts, and concepts provided in this publication are for educational and informational purposes only and do not constitute financial, investment, or trading advice. Trading in financial markets (including Forex, Crypto, Stocks, and Commodities) carries a high level of risk and may not be suitable for all investors. You could lose some or all of your initial investment. Past performance is not indicative of future results. Always conduct your own due diligence, backtest any strategy thoroughly, and consult with a certified financial advisor before making any trading decisions. By using this script, you acknowledge that you are solely responsible for your own trading actions and outcomes.
Overview
Traditional Support and Resistance lines rely on lagging historical pivots. The Quantum Dynamic Mitigation Zones indicator brings true institutional order flow to your charts. It scans for massive, statistically significant volume anomalies (Whale executions) and draws rigid Supply and Demand zones forward in time. Most importantly, it visually simulates order book "Mitigation"—as price wicks back into these zones, the boxes physically shrink, showing you exactly how much institutional liquidity has been "eaten" before the level finally breaks.
Key Highlights
• Anomaly Detection: Scans the current timeframe for extreme volume spikes (e.g., 300%+ above the moving average) to identify where institutional money stepped in.
• Dynamic Mitigation Engine: As future price action retraces into a drawn zone, the script permanently erases the portion of the box that price touched.
• Visual Liquidity: Instead of guessing if a level is still strong, you can literally see if the box is wide and heavily defended, or if it has been reduced to a thin sliver about to break.
How to Trade It
When an anomaly zone is first created, do not chase the breakout. Wait for price to naturally retrace back to the box. If the price taps the edge of the box and rejects strongly, buy/sell the bounce. If price begins heavily "eating" into the box, narrowing its size, assume the institutional defense is depleted and prepare to trade the continuation breakout through the zone.
⚠️ DISCLAIMER: STRICTLY FOR EDUCATIONAL PURPOSES
The information, scripts, and concepts provided in this publication are for educational and informational purposes only and do not constitute financial, investment, or trading advice. Trading in financial markets (including Forex, Crypto, Stocks, and Commodities) carries a high level of risk and may not be suitable for all investors. You could lose some or all of your initial investment. Past performance is not indicative of future results. Always conduct your own due diligence, backtest any strategy thoroughly, and consult with a certified financial advisor before making any trading decisions. By using this script, you acknowledge that you are solely responsible for your own trading actions and outcomes.
Catatan Rilis
Added a grading system to the S/R zones.Skrip open-source
Dengan semangat TradingView yang sesungguhnya, pembuat skrip ini telah menjadikannya sebagai sumber terbuka, sehingga para trader dapat meninjau dan memverifikasi fungsinya. Salut untuk penulisnya! Meskipun Anda dapat menggunakannya secara gratis, perlu diingat bahwa penerbitan ulang kode ini tunduk pada Tata Tertib kami.

Pernyataan Penyangkalan
Informasi dan publikasi ini tidak dimaksudkan, dan bukan merupakan, saran atau rekomendasi keuangan, investasi, trading, atau jenis lainnya yang diberikan atau didukung oleh TradingView. Baca selengkapnya di Ketentuan Penggunaan.
Skrip open-source
Dengan semangat TradingView yang sesungguhnya, pembuat skrip ini telah menjadikannya sebagai sumber terbuka, sehingga para trader dapat meninjau dan memverifikasi fungsinya. Salut untuk penulisnya! Meskipun Anda dapat menggunakannya secara gratis, perlu diingat bahwa penerbitan ulang kode ini tunduk pada Tata Tertib kami.
Pernyataan Penyangkalan
Informasi dan publikasi ini tidak dimaksudkan, dan bukan merupakan, saran atau rekomendasi keuangan, investasi, trading, atau jenis lainnya yang diberikan atau didukung oleh TradingView. Baca selengkapnya di Ketentuan Penggunaan.