OPEN-SOURCE SCRIPT
SpxSnipper - Compact Sector RS Dashboard
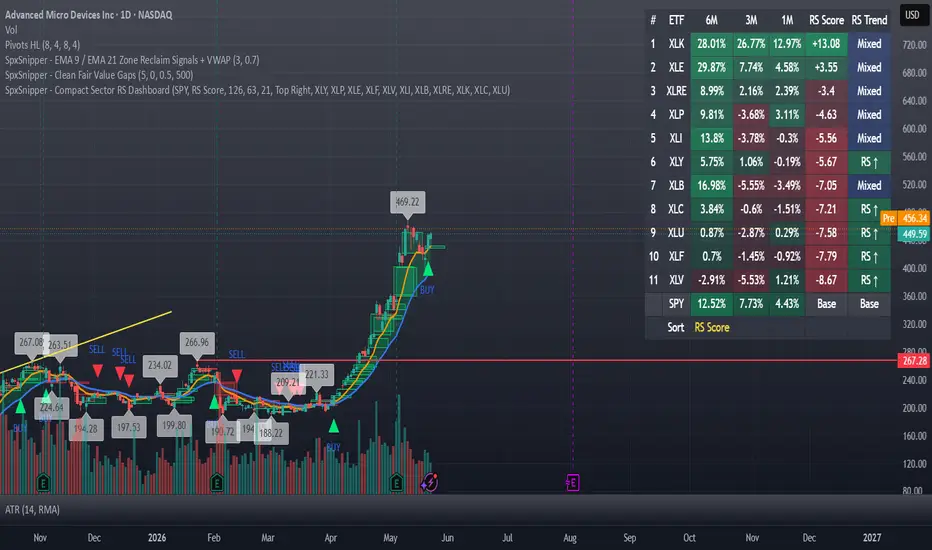
SpxSnipper - Compact Sector RS Dashboard
This indicator displays a compact sector relative strength dashboard using the major SPDR sector ETFs and SPY as the benchmark.
The dashboard ranks sectors based on recent performance and relative strength. It shows each sector ETF’s performance over three timeframes:
• 6 months
• 3 months
• 1 month
The default sector list includes:
XLY, XLP, XLE, XLF, XLV, XLI, XLB, XLRE, XLK, XLC, and XLU.
Benchmark:
SPY is used as the default benchmark for relative strength calculations.
Main columns:
6M / 3M / 1M:
These columns show the absolute percentage return of each sector ETF over the selected lookback periods.
RS Score:
The RS Score is a weighted relative strength score versus SPY. It compares each sector’s performance against SPY across the 6M, 3M, and 1M periods, with more weight given to recent performance.
Formula:
RS Score =
Relative 6M × 20%
+ Relative 3M × 30%
+ Relative 1M × 50%
Where:
Relative Return = Sector ETF Return - SPY Return
A positive RS Score means the sector has outperformed SPY on a weighted relative basis.
A negative RS Score means the sector has underperformed SPY on a weighted relative basis.
RS Trend:
RS Trend evaluates whether the sector’s relative strength versus SPY is improving, weakening, or mixed across the three timeframes.
The logic is:
RS ↑:
Relative strength is improving from 6M to 3M to 1M.
This means:
Rel 1M > Rel 3M > Rel 6M
RS ↓:
Relative strength is weakening from 6M to 3M to 1M.
This means:
Rel 1M < Rel 3M < Rel 6M
Mixed:
There is no clear sequential improvement or deterioration in relative strength.
How to use:
This dashboard is intended to help visually compare sector performance and sector rotation. It can be used to identify sectors that are outperforming or underperforming SPY across multiple timeframes.
The RS Score is useful for ranking sectors by weighted relative strength, while RS Trend helps identify whether that relative strength is improving or deteriorating.
Suggested interpretation:
• High RS Score + RS ↑ may indicate improving relative leadership.
• High RS Score + Mixed may indicate strong performance but less consistent relative acceleration.
• Low or negative RS Score + RS ↓ may indicate relative weakness.
• Positive absolute performance does not always mean sector leadership; relative performance versus SPY is also important.
Customization:
Users can adjust:
• Benchmark symbol
• Sector ETF symbols
• Lookback periods for 6M, 3M, and 1M
• Sorting method
• Table position
Important note:
This indicator is designed for market analysis and sector comparison only. It does not provide buy or sell recommendations. Users should combine sector analysis with their own trading plan, risk management, and additional confirmation tools.
This script is for educational and analytical purposes only and does not provide financial advice.
Skrip open-source
Dengan semangat TradingView yang sesungguhnya, pembuat skrip ini telah menjadikannya sebagai sumber terbuka, sehingga para trader dapat meninjau dan memverifikasi fungsinya. Salut untuk penulisnya! Meskipun Anda dapat menggunakannya secara gratis, perlu diingat bahwa penerbitan ulang kode ini tunduk pada Tata Tertib kami.

Pernyataan Penyangkalan
Informasi dan publikasi ini tidak dimaksudkan, dan bukan merupakan, saran atau rekomendasi keuangan, investasi, trading, atau jenis lainnya yang diberikan atau didukung oleh TradingView. Baca selengkapnya di Ketentuan Penggunaan.
Skrip open-source
Dengan semangat TradingView yang sesungguhnya, pembuat skrip ini telah menjadikannya sebagai sumber terbuka, sehingga para trader dapat meninjau dan memverifikasi fungsinya. Salut untuk penulisnya! Meskipun Anda dapat menggunakannya secara gratis, perlu diingat bahwa penerbitan ulang kode ini tunduk pada Tata Tertib kami.
Pernyataan Penyangkalan
Informasi dan publikasi ini tidak dimaksudkan, dan bukan merupakan, saran atau rekomendasi keuangan, investasi, trading, atau jenis lainnya yang diberikan atau didukung oleh TradingView. Baca selengkapnya di Ketentuan Penggunaan.