CRT Confluence Map
OVERVIEW
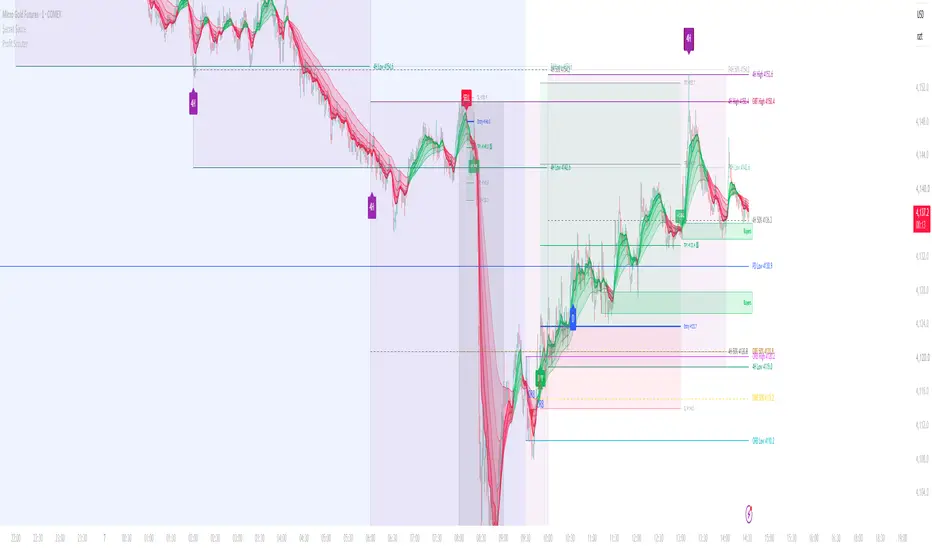
This indicator combines several intraday reference levels and reversal tools in one overlay: the 8 AM New York CRT range, the 4H CRT range, the previous day's range, the New York Opening Range Breakout (ORB), swing-structure reversal detection, and a volume-based buying/selling pressure estimate. It is designed for intraday charts (1-minute to 15-minute) on futures such as gold (MGC/GC), but works on any symbol with session data.
1) 8AM CRT (Candle Range Theory)
- Records the high, low and 50% midpoint of the 8:00–9:00 AM New York candle and projects these levels through the session (default 9:00 AM–4:00 PM).
- Signal: price trades below the CRT low (or above the CRT high) and the candle closes back inside the range. This "sweep and reclaim" is marked with a CRT label. Common targets are the 50% level and the opposite side of the range.
2) 4H CRT
- Projects the last completed 4-hour candle's high, low and 50% through the current 4-hour candle, plus the 4-hour candle before it (P4H) as dotted lines.
- Signal: a sweep beyond the previous 4H high or low that closes back inside, marked "4H".
- The trend box compares the last two 4H candles (higher high + higher low = bullish, lower high + lower low = bearish, otherwise expansion or inside).
3) Daily CRT
- Projects the previous trading day's high, low and 50% (futures session, 6 PM–5 PM NY) through the current day.
- Signal: a sweep of the previous day's high or low with a close back inside, marked "D". The daily trend is classified the same way as the 4H trend.
4) NY ORB (Opening Range Breakout)
- Builds an opening range from a selectable start (8:20 COMEX open, 8:30 post-news, 9:30 equity open, or custom) and length (default 5 minutes).
- Signal: the first full candle close above the range high or below the range low within the signal window. The ORB 50% level is a common invalidation point.
5) Reversal Detection
- Swing structure: confirmed swing highs/lows labeled HH, HL, LH, LL (labels appear after the swing-strength number of candles).
- SFP (Swing Failure Pattern): price sweeps the most recent swing high/low and closes back inside. A ★ marks SFPs that occur within a set distance of an active Daily, CRT, 4H, P4H or ORB level.
- MSS (Market Structure Shift): after an SFP, a close beyond the opposite swing level within a set number of candles confirms the reversal.
6) Buying / Selling Pressure
- Estimates buying vs. selling volume from where each candle closes within its range, weighted by volume. This is an approximation from OHLCV data, not true order-flow or bid/ask data.
- Candles with unusually strong one-sided pressure (relative to the recent average) create "Buyers" or "Sellers" zones, which are removed once price closes through them.
- The trend box shows the buying vs. selling share over a rolling window.
ALERTS
Alert conditions are included for every signal: 8AM / 4H / Daily CRT sweeps (bullish and bearish), ORB breaks, SFPs, SFPs at key levels, MSS confirmations, strong buying/selling pressure, and price returning to a pressure zone. Create them from the alert menu by selecting this indicator and the condition you want.
HOW TO USE
- Use a chart timeframe of 1 minute for a 5-minute ORB (the timeframe must be equal to or lower than the ORB length). 8AM CRT requires 1H or lower; 4H CRT below 4H; Daily CRT below 1D.
- A common workflow: note the daily and 4H trend, wait for a sweep of a key level (CRT, PD, 4H, ORB), then look for an SFP and MSS in the same direction before considering a trade.
- Every section can be turned on or off, and colors, sessions and history length are adjustable in the settings.
NOTES
Signals are evaluated on candle close, but levels and labels on the current candle can change until it closes. This script is a charting and analysis tool, not financial advice, and past signals do not guarantee future results.
This indicator combines several intraday reference levels and reversal tools in one overlay: the 8 AM New York CRT range, the 4H CRT range, the previous day's range, the New York Opening Range Breakout (ORB), swing-structure reversal detection, and a volume-based buying/selling pressure estimate. It is designed for intraday charts (1-minute to 15-minute) on futures such as gold (MGC/GC), but works on any symbol with session data.
1) 8AM CRT (Candle Range Theory)
- Records the high, low and 50% midpoint of the 8:00–9:00 AM New York candle and projects these levels through the session (default 9:00 AM–4:00 PM).
- Signal: price trades below the CRT low (or above the CRT high) and the candle closes back inside the range. This "sweep and reclaim" is marked with a CRT label. Common targets are the 50% level and the opposite side of the range.
2) 4H CRT
- Projects the last completed 4-hour candle's high, low and 50% through the current 4-hour candle, plus the 4-hour candle before it (P4H) as dotted lines.
- Signal: a sweep beyond the previous 4H high or low that closes back inside, marked "4H".
- The trend box compares the last two 4H candles (higher high + higher low = bullish, lower high + lower low = bearish, otherwise expansion or inside).
3) Daily CRT
- Projects the previous trading day's high, low and 50% (futures session, 6 PM–5 PM NY) through the current day.
- Signal: a sweep of the previous day's high or low with a close back inside, marked "D". The daily trend is classified the same way as the 4H trend.
4) NY ORB (Opening Range Breakout)
- Builds an opening range from a selectable start (8:20 COMEX open, 8:30 post-news, 9:30 equity open, or custom) and length (default 5 minutes).
- Signal: the first full candle close above the range high or below the range low within the signal window. The ORB 50% level is a common invalidation point.
5) Reversal Detection
- Swing structure: confirmed swing highs/lows labeled HH, HL, LH, LL (labels appear after the swing-strength number of candles).
- SFP (Swing Failure Pattern): price sweeps the most recent swing high/low and closes back inside. A ★ marks SFPs that occur within a set distance of an active Daily, CRT, 4H, P4H or ORB level.
- MSS (Market Structure Shift): after an SFP, a close beyond the opposite swing level within a set number of candles confirms the reversal.
6) Buying / Selling Pressure
- Estimates buying vs. selling volume from where each candle closes within its range, weighted by volume. This is an approximation from OHLCV data, not true order-flow or bid/ask data.
- Candles with unusually strong one-sided pressure (relative to the recent average) create "Buyers" or "Sellers" zones, which are removed once price closes through them.
- The trend box shows the buying vs. selling share over a rolling window.
ALERTS
Alert conditions are included for every signal: 8AM / 4H / Daily CRT sweeps (bullish and bearish), ORB breaks, SFPs, SFPs at key levels, MSS confirmations, strong buying/selling pressure, and price returning to a pressure zone. Create them from the alert menu by selecting this indicator and the condition you want.
HOW TO USE
- Use a chart timeframe of 1 minute for a 5-minute ORB (the timeframe must be equal to or lower than the ORB length). 8AM CRT requires 1H or lower; 4H CRT below 4H; Daily CRT below 1D.
- A common workflow: note the daily and 4H trend, wait for a sweep of a key level (CRT, PD, 4H, ORB), then look for an SFP and MSS in the same direction before considering a trade.
- Every section can be turned on or off, and colors, sessions and history length are adjustable in the settings.
NOTES
Signals are evaluated on candle close, but levels and labels on the current candle can change until it closes. This script is a charting and analysis tool, not financial advice, and past signals do not guarantee future results.

1 Trade Away
Pernyataan Penyangkalan
Informasi dan publikasi ini tidak dimaksudkan, dan bukan merupakan, saran atau rekomendasi keuangan, investasi, trading, atau jenis lainnya yang diberikan atau didukung oleh TradingView. Baca selengkapnya di Ketentuan Penggunaan.
1 Trade Away
Pernyataan Penyangkalan
Informasi dan publikasi ini tidak dimaksudkan, dan bukan merupakan, saran atau rekomendasi keuangan, investasi, trading, atau jenis lainnya yang diberikan atau didukung oleh TradingView. Baca selengkapnya di Ketentuan Penggunaan.