Apex Flow Trend [ATR Trail]
Apex Flow Trend [ATR Trail]
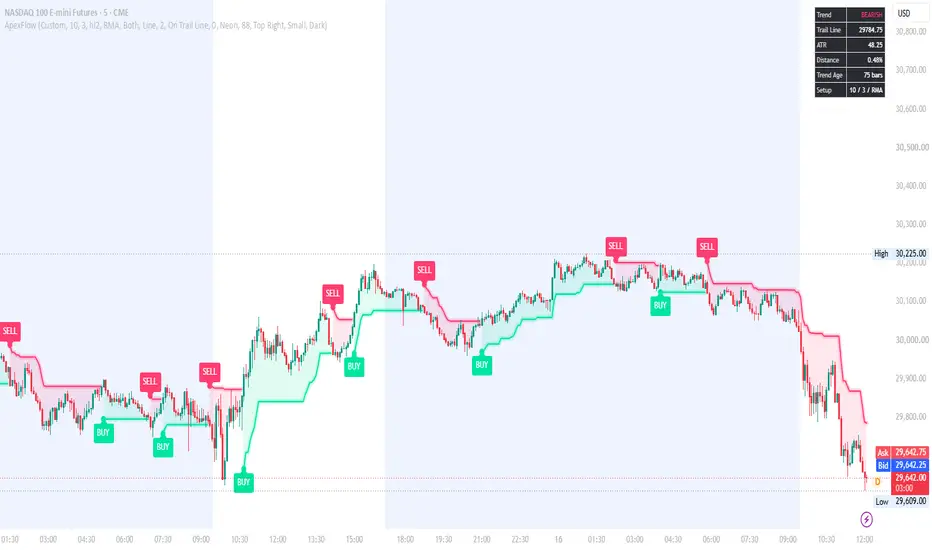
Apex Flow Trend is a volatility-based trend-following overlay built on the Supertrend concept. It plots a trailing line that sits below price in uptrends and above price in downtrends, and flips when price closes through it. The trail adapts to market volatility using the Average True Range (ATR), so it widens in fast markets and tightens in quiet ones.
HOW IT WORKS
1. The script calculates ATR over your chosen period and smoothing method.
2. It builds two bands around the source price: source minus (ATR × multiplier) and source plus (ATR × multiplier).
3. The lower band only ratchets upward while the trend is bullish, and the upper band only ratchets downward while the trend is bearish, so the trail never loosens against the trend.
4. When price closes beyond the opposite band, the trend flips and the trail jumps to the other side.
FEATURES
- ATR smoothing choice: RMA (classic Wilder), SMA, EMA or WMA
- Adjustable ATR period, multiplier and price source
- Trend zone fill between price and the trail, with adjustable transparency
- Optional line glow for readability on busy charts
- Flip markers and optional BUY / SELL labels
- Optional candle coloring by trend direction
- Fully editable bull and bear colors
- On-chart dashboard: trend direction, trail price, current ATR, distance from the trail (%), and trend age in bars
- Alerts for Buy, Sell and any Direction Change
SETTINGS
- ATR Period: lookback for volatility. Lower values react faster, higher values are smoother. Default 10.
- ATR Multiplier: distance of the trail from price. Higher values give fewer, later signals. Lower values give more, earlier signals. Default 3.0.
- ATR Smoothing: how True Range is averaged. RMA is the standard; EMA and WMA respond faster; SMA is steadier.
- Source: price input for the bands. Default hl2.
HOW TO USE IT
- Use the trail line as a dynamic trend filter or trailing reference level.
- Treat the dashboard's distance and trend age as context: a long-running trend far from its trail may be extended, while a fresh flip is less proven.
- Combine with your own confirmation (structure, volume, higher-timeframe bias) rather than trading flips in isolation.
- In choppy, sideways markets, trend-following trails produce frequent flips. Consider a higher multiplier or a higher timeframe.
ALERTS
Create alerts from the indicator menu using "Apex Flow Buy", "Apex Flow Sell" or "Apex Flow Direction Change". Signals are calculated on bar close, so setting the alert to "Once Per Bar Close" avoids mid-bar flicker.
NOTES
- Signals are based on closed-bar data and do not use higher-timeframe lookahead.
- This is an indicator, not a strategy. It does not place orders or report backtest results.
- This script is an updated and restyled take on the widely known Supertrend approach, rewritten in Pine v6 with extra smoothing options, visuals and a dashboard.
DISCLAIMER
This script is for educational and informational purposes only and is not financial advice. Past behavior does not guarantee future results. Always test on your own markets and timeframes and manage risk appropriately.
Original idea Taken from supertrend and improved to V6
Apex Flow Trend is a volatility-based trend-following overlay built on the Supertrend concept. It plots a trailing line that sits below price in uptrends and above price in downtrends, and flips when price closes through it. The trail adapts to market volatility using the Average True Range (ATR), so it widens in fast markets and tightens in quiet ones.
HOW IT WORKS
1. The script calculates ATR over your chosen period and smoothing method.
2. It builds two bands around the source price: source minus (ATR × multiplier) and source plus (ATR × multiplier).
3. The lower band only ratchets upward while the trend is bullish, and the upper band only ratchets downward while the trend is bearish, so the trail never loosens against the trend.
4. When price closes beyond the opposite band, the trend flips and the trail jumps to the other side.
FEATURES
- ATR smoothing choice: RMA (classic Wilder), SMA, EMA or WMA
- Adjustable ATR period, multiplier and price source
- Trend zone fill between price and the trail, with adjustable transparency
- Optional line glow for readability on busy charts
- Flip markers and optional BUY / SELL labels
- Optional candle coloring by trend direction
- Fully editable bull and bear colors
- On-chart dashboard: trend direction, trail price, current ATR, distance from the trail (%), and trend age in bars
- Alerts for Buy, Sell and any Direction Change
SETTINGS
- ATR Period: lookback for volatility. Lower values react faster, higher values are smoother. Default 10.
- ATR Multiplier: distance of the trail from price. Higher values give fewer, later signals. Lower values give more, earlier signals. Default 3.0.
- ATR Smoothing: how True Range is averaged. RMA is the standard; EMA and WMA respond faster; SMA is steadier.
- Source: price input for the bands. Default hl2.
HOW TO USE IT
- Use the trail line as a dynamic trend filter or trailing reference level.
- Treat the dashboard's distance and trend age as context: a long-running trend far from its trail may be extended, while a fresh flip is less proven.
- Combine with your own confirmation (structure, volume, higher-timeframe bias) rather than trading flips in isolation.
- In choppy, sideways markets, trend-following trails produce frequent flips. Consider a higher multiplier or a higher timeframe.
ALERTS
Create alerts from the indicator menu using "Apex Flow Buy", "Apex Flow Sell" or "Apex Flow Direction Change". Signals are calculated on bar close, so setting the alert to "Once Per Bar Close" avoids mid-bar flicker.
NOTES
- Signals are based on closed-bar data and do not use higher-timeframe lookahead.
- This is an indicator, not a strategy. It does not place orders or report backtest results.
- This script is an updated and restyled take on the widely known Supertrend approach, rewritten in Pine v6 with extra smoothing options, visuals and a dashboard.
DISCLAIMER
This script is for educational and informational purposes only and is not financial advice. Past behavior does not guarantee future results. Always test on your own markets and timeframes and manage risk appropriately.
Original idea Taken from supertrend and improved to V6

Pernyataan Penyangkalan
Informasi dan publikasi ini tidak dimaksudkan, dan bukan merupakan, saran atau rekomendasi keuangan, investasi, trading, atau jenis lainnya yang diberikan atau didukung oleh TradingView. Baca selengkapnya di Ketentuan Penggunaan.
Pernyataan Penyangkalan
Informasi dan publikasi ini tidak dimaksudkan, dan bukan merupakan, saran atau rekomendasi keuangan, investasi, trading, atau jenis lainnya yang diberikan atau didukung oleh TradingView. Baca selengkapnya di Ketentuan Penggunaan.