TTG SNIPER STRAT DASHBOARD TP/SL
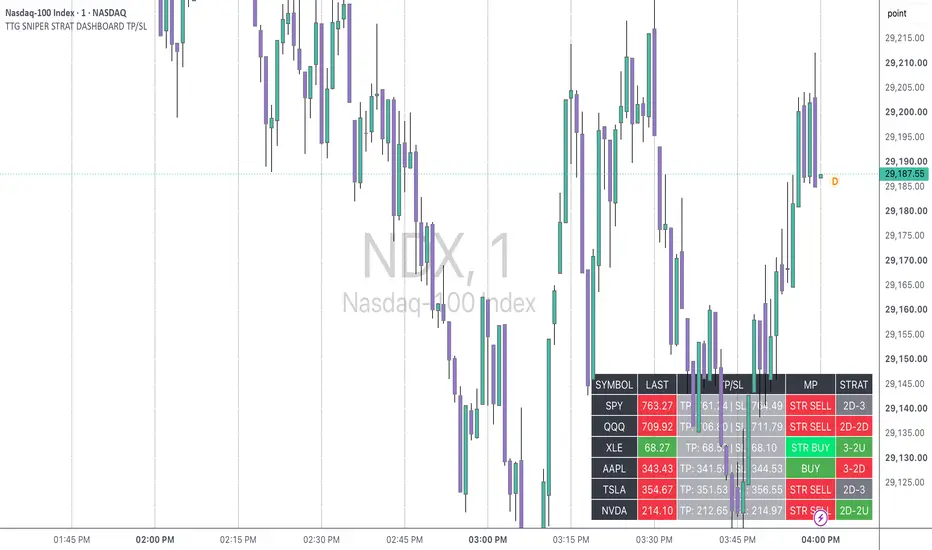
# TTG SNIPER DASHBOARD — Market Pulse, TP/SL & Live STRAT Patterns
The **TTG Sniper Dashboard** is an advanced multi-ticker TradingView indicator designed to help traders monitor market momentum, identify price action patterns, and manage potential trade entries and exits from one customizable dashboard.
Combining **Market Pulse, ATR-based profit targets and stop losses, and live STRAT candle sequences**, this indicator provides a comprehensive view of market direction and developing trading opportunities.
### Key Features
**1. Multi-Ticker Dashboard**
- Monitor up to 6 customizable stocks or ETFs simultaneously.
- View live prices with green and red directional backgrounds.
- Adjustable dashboard position, text size, and timeframes.
**2. Market Pulse (MP)**
- **STR BUY:** Strong bullish alignment above VWAP and the 20, 72, and 200 EMAs.
- **BUY:** Bullish momentum based on an adaptive moving average.
- **SELL:** Bearish momentum based on an adaptive moving average.
- **STR SELL:** Strong bearish alignment below VWAP and all three EMAs.
- **NEUTRAL:** No clear directional momentum.
**3. ATR-Based Take-Profit & Stop-Loss Levels**
- Automatically calculates potential TP and SL price levels.
- Uses ATR to estimate price movement and the 20 EMA to determine directional bias.
- Adjustable ATR multipliers and timeframe settings.
**4. Live STRAT Candle Sequence Detection**
The STRAT column continuously displays the previous and current candle classifications, allowing traders to identify developing setups and directional changes.
**Color-Coded STRAT Patterns:**
- 🟢 **2D-2U:** Bullish reversal
- 🔴 **2U-2D:** Bearish reversal
- 🟢 **1-2U:** Bullish breakout
- 🔴 **1-2D:** Bearish breakdown
- 🟡 **3-1:** Inside bar following an outside bar
- 🟡 **1-1:** Double inside bar
- 🟡 **2U-1 / 2D-1:** Inside bar consolidation
- 🟢 **3-2U:** Bullish directional breakout
- 🔴 **3-2D:** Bearish directional breakdown
Outside bars (3) display a neutral color by default.
**5. Live or Confirmed Candle Mode**
- **Live Mode:** Displays the previous candle and the current developing candle, updating as the STRAT classification changes.
- **Confirmed Mode:** Displays the two most recently completed candles to avoid unfinished candle signals.
- Customizable bullish, bearish, inside-bar, and neutral colors.
### Customizable Timeframes
Independently configure the Market Pulse, TP/SL, and STRAT timeframes to analyze short-term price action, intraday momentum, swing trading opportunities, and longer-term setups.
### Ideal For
- Day trading and swing trading
- Options and LEAPS analysis
- STRAT 2-2 reversal setups
- Inside-bar breakout strategies
- Multi-ticker momentum monitoring
- Identifying potential entries, exits, and consolidation patterns
### Why Use the TTG Sniper Dashboard?
Instead of switching between multiple charts and indicators, traders can monitor **price direction, momentum strength, potential risk levels, and developing STRAT patterns in one organized display**.
The dashboard is designed to help traders recognize opportunities, maintain awareness of changing market conditions, and make more structured trading decisions.
**One Dashboard. Multiple Tickers. Live STRAT Setups. Smarter Trade Planning.**
*Disclaimer: This indicator is intended for educational and analytical purposes only. Live STRAT classifications may change before candle close. Market Pulse signals and ATR-based TP/SL levels do not guarantee future price movement or trading results.*
The **TTG Sniper Dashboard** is an advanced multi-ticker TradingView indicator designed to help traders monitor market momentum, identify price action patterns, and manage potential trade entries and exits from one customizable dashboard.
Combining **Market Pulse, ATR-based profit targets and stop losses, and live STRAT candle sequences**, this indicator provides a comprehensive view of market direction and developing trading opportunities.
### Key Features
**1. Multi-Ticker Dashboard**
- Monitor up to 6 customizable stocks or ETFs simultaneously.
- View live prices with green and red directional backgrounds.
- Adjustable dashboard position, text size, and timeframes.
**2. Market Pulse (MP)**
- **STR BUY:** Strong bullish alignment above VWAP and the 20, 72, and 200 EMAs.
- **BUY:** Bullish momentum based on an adaptive moving average.
- **SELL:** Bearish momentum based on an adaptive moving average.
- **STR SELL:** Strong bearish alignment below VWAP and all three EMAs.
- **NEUTRAL:** No clear directional momentum.
**3. ATR-Based Take-Profit & Stop-Loss Levels**
- Automatically calculates potential TP and SL price levels.
- Uses ATR to estimate price movement and the 20 EMA to determine directional bias.
- Adjustable ATR multipliers and timeframe settings.
**4. Live STRAT Candle Sequence Detection**
The STRAT column continuously displays the previous and current candle classifications, allowing traders to identify developing setups and directional changes.
**Color-Coded STRAT Patterns:**
- 🟢 **2D-2U:** Bullish reversal
- 🔴 **2U-2D:** Bearish reversal
- 🟢 **1-2U:** Bullish breakout
- 🔴 **1-2D:** Bearish breakdown
- 🟡 **3-1:** Inside bar following an outside bar
- 🟡 **1-1:** Double inside bar
- 🟡 **2U-1 / 2D-1:** Inside bar consolidation
- 🟢 **3-2U:** Bullish directional breakout
- 🔴 **3-2D:** Bearish directional breakdown
Outside bars (3) display a neutral color by default.
**5. Live or Confirmed Candle Mode**
- **Live Mode:** Displays the previous candle and the current developing candle, updating as the STRAT classification changes.
- **Confirmed Mode:** Displays the two most recently completed candles to avoid unfinished candle signals.
- Customizable bullish, bearish, inside-bar, and neutral colors.
### Customizable Timeframes
Independently configure the Market Pulse, TP/SL, and STRAT timeframes to analyze short-term price action, intraday momentum, swing trading opportunities, and longer-term setups.
### Ideal For
- Day trading and swing trading
- Options and LEAPS analysis
- STRAT 2-2 reversal setups
- Inside-bar breakout strategies
- Multi-ticker momentum monitoring
- Identifying potential entries, exits, and consolidation patterns
### Why Use the TTG Sniper Dashboard?
Instead of switching between multiple charts and indicators, traders can monitor **price direction, momentum strength, potential risk levels, and developing STRAT patterns in one organized display**.
The dashboard is designed to help traders recognize opportunities, maintain awareness of changing market conditions, and make more structured trading decisions.
**One Dashboard. Multiple Tickers. Live STRAT Setups. Smarter Trade Planning.**
*Disclaimer: This indicator is intended for educational and analytical purposes only. Live STRAT classifications may change before candle close. Market Pulse signals and ATR-based TP/SL levels do not guarantee future price movement or trading results.*

Pernyataan Penyangkalan
Informasi dan publikasi ini tidak dimaksudkan, dan bukan merupakan, saran atau rekomendasi keuangan, investasi, trading, atau jenis lainnya yang diberikan atau didukung oleh TradingView. Baca selengkapnya di Ketentuan Penggunaan.
Pernyataan Penyangkalan
Informasi dan publikasi ini tidak dimaksudkan, dan bukan merupakan, saran atau rekomendasi keuangan, investasi, trading, atau jenis lainnya yang diberikan atau didukung oleh TradingView. Baca selengkapnya di Ketentuan Penggunaan.