OPEN-SOURCE SCRIPT
Thermal Candlestick Spectrogram [Jamallo]
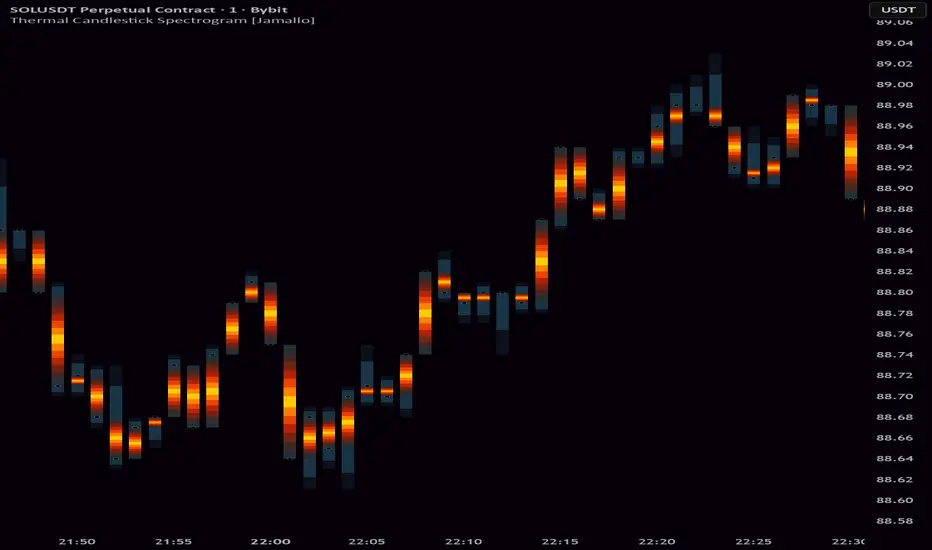
The Thermal Candlestick Spectrogram replaces flat, binary candlesticks with a heat-mapped view of price density. Every bar radiates outward from a white-hot core through layers of orange, red, and deep amber — the same way thermal imaging reveals intensity beneath a surface. The result is a chart that doesn't just show you what price did, it shows you how concentrated that move was.
How It Works
A 7-layer gradient stack is anchored to each candle's midpoint and expands symmetrically toward the edges of the body. Transparency increases with each outer layer, creating a natural falloff that mimics heat dissipation:
White-yellow core — maximum density at the center of the body
Orange-red mantle — transitional layers that reveal the spread of price action
Dark outer boundary — a near-transparent edge that lets candles breathe without hard lines
Fading wicks — a dual-layer vertical fade that tapers wicks naturally toward the High and Low extremes, reducing visual noise
Anti-aliased price dot — a precision close marker with a subtle white halo for clean real-time tracking
Design & Performance
The entire effect runs on a fixed 9-plot architecture (7 body layers + 2 wick layers), keeping script weight low and render performance stable even alongside other indicators. No dynamic loops, no repainting — just a clean, deterministic stack that works across all timeframes and instruments.
Visual Comparison

Traditional flat candles vs. the Thermal Spectrogram — same data, entirely different depth.
How It Works
A 7-layer gradient stack is anchored to each candle's midpoint and expands symmetrically toward the edges of the body. Transparency increases with each outer layer, creating a natural falloff that mimics heat dissipation:
White-yellow core — maximum density at the center of the body
Orange-red mantle — transitional layers that reveal the spread of price action
Dark outer boundary — a near-transparent edge that lets candles breathe without hard lines
Fading wicks — a dual-layer vertical fade that tapers wicks naturally toward the High and Low extremes, reducing visual noise
Anti-aliased price dot — a precision close marker with a subtle white halo for clean real-time tracking
Design & Performance
The entire effect runs on a fixed 9-plot architecture (7 body layers + 2 wick layers), keeping script weight low and render performance stable even alongside other indicators. No dynamic loops, no repainting — just a clean, deterministic stack that works across all timeframes and instruments.
Visual Comparison
Traditional flat candles vs. the Thermal Spectrogram — same data, entirely different depth.
Skrip open-source
Dengan semangat TradingView yang sesungguhnya, pembuat skrip ini telah menjadikannya sebagai sumber terbuka, sehingga para trader dapat meninjau dan memverifikasi fungsinya. Salut untuk penulisnya! Meskipun Anda dapat menggunakannya secara gratis, perlu diingat bahwa penerbitan ulang kode ini tunduk pada Tata Tertib kami.

Join the Growing (Econophysics Trading) Community! ⚛️
discord.com/invite/qb4RKFdwYJ
Trade the physics of price.
discord.com/invite/qb4RKFdwYJ
Trade the physics of price.
Pernyataan Penyangkalan
Informasi dan publikasi ini tidak dimaksudkan, dan bukan merupakan, saran atau rekomendasi keuangan, investasi, trading, atau jenis lainnya yang diberikan atau didukung oleh TradingView. Baca selengkapnya di Ketentuan Penggunaan.
Skrip open-source
Dengan semangat TradingView yang sesungguhnya, pembuat skrip ini telah menjadikannya sebagai sumber terbuka, sehingga para trader dapat meninjau dan memverifikasi fungsinya. Salut untuk penulisnya! Meskipun Anda dapat menggunakannya secara gratis, perlu diingat bahwa penerbitan ulang kode ini tunduk pada Tata Tertib kami.
Join the Growing (Econophysics Trading) Community! ⚛️
discord.com/invite/qb4RKFdwYJ
Trade the physics of price.
discord.com/invite/qb4RKFdwYJ
Trade the physics of price.
Pernyataan Penyangkalan
Informasi dan publikasi ini tidak dimaksudkan, dan bukan merupakan, saran atau rekomendasi keuangan, investasi, trading, atau jenis lainnya yang diberikan atau didukung oleh TradingView. Baca selengkapnya di Ketentuan Penggunaan.