OPEN-SOURCE SCRIPT
Liquidity Sweep Engine [I.M]
# Liquidity Sweep Engine [I.M]
## Adaptive Ribbon · Smart Zones · Confidence Score
---
## OVERVIEW
The Liquidity Sweep Engine ("LSE [I.M]") is a discretionary-trading companion
that unifies four complementary market-structure components into a single
overlay: an **Adaptive Hull Ribbon**, a **BoS / CHoCH state machine**,
**Smart Zones** with a strength score, and a **Confidence Score panel**.
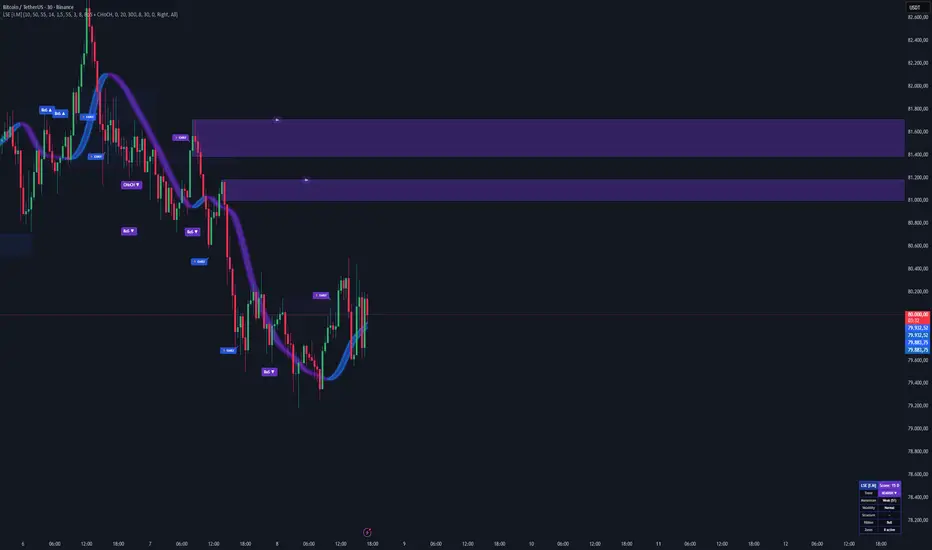
The screenshot below shows everything working together on BTCUSDT (Binance) on
the 30-minute timeframe — refer back to it throughout the description, since
each section refers to the same chart.
📊 **Live example chart:**

---
## WHAT YOU SEE ON THE CHART
Looking at the example image, from left to right and bottom to top:
- The **blue / purple ribbon** that snakes through the candles is the Adaptive
Hull Ribbon. Blue means slope-up (bullish momentum), purple means slope-down
(bearish momentum). The colour change marks where short-term momentum flips.
- Each **"BoS ▲"** or **"BoS ▼"** label at a dashed horizontal line is a
*Break of Structure* — the moment price closed past an unbroken swing high
(▲) or low (▼) **in the same direction as the existing trend**.
- Each **"CHoCH ▲"** or **"CHoCH ▼"** label is a *Change of Character* —
price broke a pivot **against** the current trend, flipping the trend state.
In the example, "CHoCH ▼" near the top is what told us the bullish leg was
ending; the BoS ▼ chain that follows is the new bearish trend confirming
itself.
- The **purple boxes extending to the right** are bearish Smart Zones (created
on bearish breaks). The **blue box** lower on the chart is a bullish Smart
Zone. Each zone is anchored to the origin candle of the move that produced
the break.
- The **EARLY** labels (small flash icons) print the first time price taps a
non-mitigated zone — a heads-up that an order-block area is being tested.
- The **panel in the bottom-right corner** is the Confidence Score: a 0–100
reading with a letter grade (D → A+), plus six rows showing the components
(Trend, Momentum, Volatility, Structure, Ribbon, active Zones).
The rest of the description explains how each of these pieces is computed.
---
## WHAT MAKES IT ORIGINAL
LSE [I.M] is not a wrapper around `ta.pivothigh` / `ta.pivotlow`. The
originality is in how four independent ideas are combined and computed:
**Adaptive Hull Ribbon with slope acceleration**
The ribbon is a Hull Moving Average (HMA) plus its 2-bar-displaced sibling,
drawn as a filled band. A second-derivative reading (`slope1 − slope2`) detects
acceleration changes *before* the two lines cross, producing a "Pre-Bull" or
"Pre-Bear" state in the panel — a leading hint that complements the lagging
visual cross. In the example chart you can see this at the very top of the
move: the ribbon thins and rolls over before the actual colour flip occurs.
**Pivot-tracking BoS / CHoCH state machine**
Pivots are stored in a typed array and individually marked as broken when
price closes past them. The script then classifies each break as BoS or CHoCH
by comparing the break direction against the current trend state, instead of
just printing every pivot violation. This is why in the example you see only
**one** "CHoCH ▼" at the reversal followed by a chain of "BoS ▼" — the trend
flip is announced exactly once, then continuation breaks take over.
**Smart Zones with composite strength score**
When a structural break occurs, the engine looks back to find the last
opposite-coloured candle (the *origin candle*) and creates a zone there. Each
zone receives a 0–100 strength value computed from a 5-bar volume window
around the origin compared to a 20-bar volume average, plus a bullish/bearish
volume ratio. Zones below a user-defined minimum strength are skipped. As
price interacts with the zone, a touch counter is updated; once price closes
through the zone it is marked as **mitigated** and the box is faded rather
than deleted, so the chart keeps its historical context (you can see this in
the example: older zones still visible but visually softer than the active
one).
**Confidence Score**
A single 0–100 reading aggregates four sub-scores: trend strength
(|MHULL−SHULL|/ATR), momentum (RSI distance from 50 in the trend direction),
volatility regime (current ATR vs its 50-bar average) and structure freshness
(CHoCH = 20, BoS = 15, none = 0). Letter grades from D to A+ summarise the
overall environment.
To the author's knowledge no public TradingView script combines these four
exact pieces with this specific scoring and zone-strength logic. Each
component on its own is a known idea; their joint computation and the way
they feed each other is what defines this script.
---
## HOW IT WORKS — STEP BY STEP
### 1. Pivot collection
The script collects pivots using the configurable lookback ("Pivot lookback",
default 10). Each pivot is stored as a typed object with bar index, price,
high/low flag and a *broken* flag.
### 2. BoS vs CHoCH classification
On each bar the script checks whether the close has moved past the most
recent unbroken pivot in the relevant direction. When it has:
- If the break direction matches the current trend state → **BoS**
(continuation).
- If the break direction reverses the current trend state → **CHoCH** (change
of character). The trend state is then flipped.
A dashed line is drawn from the broken pivot's bar to the current bar with
the corresponding label. **In the example image**, this is what produces the
horizontal dashed lines and the "BoS ▲ / BoS ▼ / CHoCH ▼" labels.
### 3. Smart Zone generation
On each structural break the script searches the prior 20 bars (configurable)
for the last candle of opposite colour to the move. That candle's high and
low form the top and bottom of the zone box. The zone is drawn extending to
the right and receives a strength score and a bullish-volume percentage.
Boxes use transparency that scales with strength (stronger zones look more
solid). **In the example image**, the two upper purple boxes were created on
the two CHoCH ▼ / BoS ▼ events near the top; the lower blue box was created
on the bullish BoS ▲ at the start of the move.
### 4. Zone lifecycle
- **Active**: visible while price has not closed through it.
- **Touched**: the touch counter increments each time price re-enters the
zone after leaving it (consecutive bars inside the zone count as a single
touch).
- **Mitigated**: when price closes past the far edge, the zone is faded and
stops extending. Mitigated zones remain on the chart by default for
historical reference; this can be disabled in the inputs.
- **Aged out**: zones older than the configurable maximum age are removed.
### 5. EARLY / CONFIRMED signals
- **EARLY** fires the first bar price enters a non-mitigated zone — an
anticipatory signal: better entry price, lower confirmation.
- **CONFIRMED** fires when the close reclaims the relevant zone edge after a
prior touch (close above the bottom for bull zones, close below the top for
bear zones) — a confirmation signal: worse entry price, higher
confirmation.
CONFIRMED has visual priority: when both fire on the same bar, only the
CONFIRMED label is shown.
### 6. Confidence Score
Each sub-score is computed every bar:
- **Trend strength (0–40):** `|MHULL − SHULL| / ATR`, scaled and capped.
- **Momentum (0–20):** RSI(14) distance from 50, in the direction of the
trend.
- **Volatility (0–20):** ATR(14) vs SMA of ATR(14, 50). Higher volatility
scores higher.
- **Structure (0–20):** 20 if a CHoCH just happened, 15 if a BoS, 0
otherwise.
The total is mapped to letter grades: A+ ≥ 85, A ≥ 70, B+ ≥ 55, B ≥ 40,
C ≥ 25, D below. **In the example image** the panel reads "Score: 15 D"
because the chart sits in a low-momentum recovery after a sustained
bearish leg — the panel correctly downgrades the environment despite the
local bullish bounce.
---
## HOW TO USE
LSE [I.M] is designed as a **context tool**, not a black-box buy/sell system.
A suggested workflow:
1. **Read the panel first.** A high Confidence grade in the same direction as
the trend means the environment is aligned. A low grade is a caution flag.
2. **Use BoS / CHoCH labels to anchor bias.** A fresh CHoCH against your
open-position direction is the most common reason to reduce or exit.
3. **Treat Smart Zones as decision areas, not magic levels.** Touch counts
and strength values help pick which zones to watch; mitigated zones are
kept for reference but should not be traded as if they were still active.
4. **EARLY signals favour preparation, CONFIRMED signals favour execution.**
Aggressive traders may use EARLY with reduced size; more conservative
traders may wait for CONFIRMED. Both are filtered by the minimum-strength
input.
5. **Combine timeframes.** The script runs on any symbol and timeframe;
reading higher-timeframe structure alongside an execution timeframe is the
intended use.
The script does not place orders, does not include backtest results, and does
not claim a win rate. All decisions remain with the trader.
---
## INPUTS
**Detection**
- *Pivot lookback* — bars on each side required for a pivot. Higher = fewer,
more significant pivots.
- *Max pivots to track* — array cap to keep the script light.
**Structure (BoS / CHoCH)**
- *Show BoS / Show CHoCH* — toggle each event type.
- *Show broken pivot lines* — dashed line from broken pivot to current bar.
- *Show HH/HL/LH/LL* — optional swing labels.
**Adaptive Ribbon**
- *Ribbon base length* — HMA length (default 55).
- *ATR length / sensitivity* — internal volatility input for slope and
acceleration reading.
- *Band fill transparency, Glow, Line widths* — pure cosmetics.
**Smart Zones**
- *Trigger on* — BoS only / CHoCH only / both.
- *Min strength* — zones below this score are not drawn.
- *Origin candle lookback / Max age / Max count / Initial length* — geometry
and lifecycle controls.
- *Keep mitigated zones (faded)* — keep history vs auto-remove on mitigation.
- *Show mid-line / Show touch count* — optional decorations.
**Entry Signals**
- *Show entry signals / Min strength for signal* — gating.
- *Show EARLY signal* — toggle anticipation labels.
- *Show confidence label* — toggle the star/grade text on signals.
**Confidence Score Panel**
- *Show panel / Position* — visibility and corner.
**Alerts / Webhook**
- *Webhook event filter* — All / BoS only / CHoCH only / Retests only.
---
## ALERTS
When an alert is created with this indicator, the alert message contains a
JSON payload such as:
```
{
"symbol": "BTCUSDT",
"tf": "15",
"event": "BUY_CONFIRMED",
"price": 80000.0,
"trend": 1,
"score": 72,
"grade": "A",
"strength": 65,
"time": "1715000000000"
}
```
Possible `event` values: `BULLISH_BOS`, `BEARISH_BOS`, `BULLISH_CHOCH`,
`BEARISH_CHOCH`, `BUY_EARLY`, `SELL_EARLY`, `BUY_CONFIRMED`, `SELL_CONFIRMED`.
This format is intended for webhook consumers that need structured data
rather than free text.
---
## NOTES AND LIMITATIONS
- All structural logic is evaluated on bar close
(`alert.freq_once_per_bar_close`). Intra-bar values may differ from the
final, confirmed reading.
- The Hull moving average is naturally smoother than EMA/SMA but still lags;
the slope-acceleration reading is the script's attempt to compensate, not
eliminate, that lag.
- Volume-based zone strength depends on the symbol providing usable volume
data. On instruments without reliable volume, strength values will be less
informative.
- The Confidence Score is a heuristic aid, not a probability. Different
markets and timeframes will live in different score ranges, and that is
expected.
---
## DISCLAIMER
This script is published for educational and informational purposes only. It
is not financial advice and does not guarantee any particular outcome. Past
behaviour of the indicator on historical data does not imply future
performance. Trade at your own risk and size positions according to your own
risk management.
## Adaptive Ribbon · Smart Zones · Confidence Score
---
## OVERVIEW
The Liquidity Sweep Engine ("LSE [I.M]") is a discretionary-trading companion
that unifies four complementary market-structure components into a single
overlay: an **Adaptive Hull Ribbon**, a **BoS / CHoCH state machine**,
**Smart Zones** with a strength score, and a **Confidence Score panel**.
The screenshot below shows everything working together on BTCUSDT (Binance) on
the 30-minute timeframe — refer back to it throughout the description, since
each section refers to the same chart.
📊 **Live example chart:**
---
## WHAT YOU SEE ON THE CHART
Looking at the example image, from left to right and bottom to top:
- The **blue / purple ribbon** that snakes through the candles is the Adaptive
Hull Ribbon. Blue means slope-up (bullish momentum), purple means slope-down
(bearish momentum). The colour change marks where short-term momentum flips.
- Each **"BoS ▲"** or **"BoS ▼"** label at a dashed horizontal line is a
*Break of Structure* — the moment price closed past an unbroken swing high
(▲) or low (▼) **in the same direction as the existing trend**.
- Each **"CHoCH ▲"** or **"CHoCH ▼"** label is a *Change of Character* —
price broke a pivot **against** the current trend, flipping the trend state.
In the example, "CHoCH ▼" near the top is what told us the bullish leg was
ending; the BoS ▼ chain that follows is the new bearish trend confirming
itself.
- The **purple boxes extending to the right** are bearish Smart Zones (created
on bearish breaks). The **blue box** lower on the chart is a bullish Smart
Zone. Each zone is anchored to the origin candle of the move that produced
the break.
- The **EARLY** labels (small flash icons) print the first time price taps a
non-mitigated zone — a heads-up that an order-block area is being tested.
- The **panel in the bottom-right corner** is the Confidence Score: a 0–100
reading with a letter grade (D → A+), plus six rows showing the components
(Trend, Momentum, Volatility, Structure, Ribbon, active Zones).
The rest of the description explains how each of these pieces is computed.
---
## WHAT MAKES IT ORIGINAL
LSE [I.M] is not a wrapper around `ta.pivothigh` / `ta.pivotlow`. The
originality is in how four independent ideas are combined and computed:
**Adaptive Hull Ribbon with slope acceleration**
The ribbon is a Hull Moving Average (HMA) plus its 2-bar-displaced sibling,
drawn as a filled band. A second-derivative reading (`slope1 − slope2`) detects
acceleration changes *before* the two lines cross, producing a "Pre-Bull" or
"Pre-Bear" state in the panel — a leading hint that complements the lagging
visual cross. In the example chart you can see this at the very top of the
move: the ribbon thins and rolls over before the actual colour flip occurs.
**Pivot-tracking BoS / CHoCH state machine**
Pivots are stored in a typed array and individually marked as broken when
price closes past them. The script then classifies each break as BoS or CHoCH
by comparing the break direction against the current trend state, instead of
just printing every pivot violation. This is why in the example you see only
**one** "CHoCH ▼" at the reversal followed by a chain of "BoS ▼" — the trend
flip is announced exactly once, then continuation breaks take over.
**Smart Zones with composite strength score**
When a structural break occurs, the engine looks back to find the last
opposite-coloured candle (the *origin candle*) and creates a zone there. Each
zone receives a 0–100 strength value computed from a 5-bar volume window
around the origin compared to a 20-bar volume average, plus a bullish/bearish
volume ratio. Zones below a user-defined minimum strength are skipped. As
price interacts with the zone, a touch counter is updated; once price closes
through the zone it is marked as **mitigated** and the box is faded rather
than deleted, so the chart keeps its historical context (you can see this in
the example: older zones still visible but visually softer than the active
one).
**Confidence Score**
A single 0–100 reading aggregates four sub-scores: trend strength
(|MHULL−SHULL|/ATR), momentum (RSI distance from 50 in the trend direction),
volatility regime (current ATR vs its 50-bar average) and structure freshness
(CHoCH = 20, BoS = 15, none = 0). Letter grades from D to A+ summarise the
overall environment.
To the author's knowledge no public TradingView script combines these four
exact pieces with this specific scoring and zone-strength logic. Each
component on its own is a known idea; their joint computation and the way
they feed each other is what defines this script.
---
## HOW IT WORKS — STEP BY STEP
### 1. Pivot collection
The script collects pivots using the configurable lookback ("Pivot lookback",
default 10). Each pivot is stored as a typed object with bar index, price,
high/low flag and a *broken* flag.
### 2. BoS vs CHoCH classification
On each bar the script checks whether the close has moved past the most
recent unbroken pivot in the relevant direction. When it has:
- If the break direction matches the current trend state → **BoS**
(continuation).
- If the break direction reverses the current trend state → **CHoCH** (change
of character). The trend state is then flipped.
A dashed line is drawn from the broken pivot's bar to the current bar with
the corresponding label. **In the example image**, this is what produces the
horizontal dashed lines and the "BoS ▲ / BoS ▼ / CHoCH ▼" labels.
### 3. Smart Zone generation
On each structural break the script searches the prior 20 bars (configurable)
for the last candle of opposite colour to the move. That candle's high and
low form the top and bottom of the zone box. The zone is drawn extending to
the right and receives a strength score and a bullish-volume percentage.
Boxes use transparency that scales with strength (stronger zones look more
solid). **In the example image**, the two upper purple boxes were created on
the two CHoCH ▼ / BoS ▼ events near the top; the lower blue box was created
on the bullish BoS ▲ at the start of the move.
### 4. Zone lifecycle
- **Active**: visible while price has not closed through it.
- **Touched**: the touch counter increments each time price re-enters the
zone after leaving it (consecutive bars inside the zone count as a single
touch).
- **Mitigated**: when price closes past the far edge, the zone is faded and
stops extending. Mitigated zones remain on the chart by default for
historical reference; this can be disabled in the inputs.
- **Aged out**: zones older than the configurable maximum age are removed.
### 5. EARLY / CONFIRMED signals
- **EARLY** fires the first bar price enters a non-mitigated zone — an
anticipatory signal: better entry price, lower confirmation.
- **CONFIRMED** fires when the close reclaims the relevant zone edge after a
prior touch (close above the bottom for bull zones, close below the top for
bear zones) — a confirmation signal: worse entry price, higher
confirmation.
CONFIRMED has visual priority: when both fire on the same bar, only the
CONFIRMED label is shown.
### 6. Confidence Score
Each sub-score is computed every bar:
- **Trend strength (0–40):** `|MHULL − SHULL| / ATR`, scaled and capped.
- **Momentum (0–20):** RSI(14) distance from 50, in the direction of the
trend.
- **Volatility (0–20):** ATR(14) vs SMA of ATR(14, 50). Higher volatility
scores higher.
- **Structure (0–20):** 20 if a CHoCH just happened, 15 if a BoS, 0
otherwise.
The total is mapped to letter grades: A+ ≥ 85, A ≥ 70, B+ ≥ 55, B ≥ 40,
C ≥ 25, D below. **In the example image** the panel reads "Score: 15 D"
because the chart sits in a low-momentum recovery after a sustained
bearish leg — the panel correctly downgrades the environment despite the
local bullish bounce.
---
## HOW TO USE
LSE [I.M] is designed as a **context tool**, not a black-box buy/sell system.
A suggested workflow:
1. **Read the panel first.** A high Confidence grade in the same direction as
the trend means the environment is aligned. A low grade is a caution flag.
2. **Use BoS / CHoCH labels to anchor bias.** A fresh CHoCH against your
open-position direction is the most common reason to reduce or exit.
3. **Treat Smart Zones as decision areas, not magic levels.** Touch counts
and strength values help pick which zones to watch; mitigated zones are
kept for reference but should not be traded as if they were still active.
4. **EARLY signals favour preparation, CONFIRMED signals favour execution.**
Aggressive traders may use EARLY with reduced size; more conservative
traders may wait for CONFIRMED. Both are filtered by the minimum-strength
input.
5. **Combine timeframes.** The script runs on any symbol and timeframe;
reading higher-timeframe structure alongside an execution timeframe is the
intended use.
The script does not place orders, does not include backtest results, and does
not claim a win rate. All decisions remain with the trader.
---
## INPUTS
**Detection**
- *Pivot lookback* — bars on each side required for a pivot. Higher = fewer,
more significant pivots.
- *Max pivots to track* — array cap to keep the script light.
**Structure (BoS / CHoCH)**
- *Show BoS / Show CHoCH* — toggle each event type.
- *Show broken pivot lines* — dashed line from broken pivot to current bar.
- *Show HH/HL/LH/LL* — optional swing labels.
**Adaptive Ribbon**
- *Ribbon base length* — HMA length (default 55).
- *ATR length / sensitivity* — internal volatility input for slope and
acceleration reading.
- *Band fill transparency, Glow, Line widths* — pure cosmetics.
**Smart Zones**
- *Trigger on* — BoS only / CHoCH only / both.
- *Min strength* — zones below this score are not drawn.
- *Origin candle lookback / Max age / Max count / Initial length* — geometry
and lifecycle controls.
- *Keep mitigated zones (faded)* — keep history vs auto-remove on mitigation.
- *Show mid-line / Show touch count* — optional decorations.
**Entry Signals**
- *Show entry signals / Min strength for signal* — gating.
- *Show EARLY signal* — toggle anticipation labels.
- *Show confidence label* — toggle the star/grade text on signals.
**Confidence Score Panel**
- *Show panel / Position* — visibility and corner.
**Alerts / Webhook**
- *Webhook event filter* — All / BoS only / CHoCH only / Retests only.
---
## ALERTS
When an alert is created with this indicator, the alert message contains a
JSON payload such as:
```
{
"symbol": "BTCUSDT",
"tf": "15",
"event": "BUY_CONFIRMED",
"price": 80000.0,
"trend": 1,
"score": 72,
"grade": "A",
"strength": 65,
"time": "1715000000000"
}
```
Possible `event` values: `BULLISH_BOS`, `BEARISH_BOS`, `BULLISH_CHOCH`,
`BEARISH_CHOCH`, `BUY_EARLY`, `SELL_EARLY`, `BUY_CONFIRMED`, `SELL_CONFIRMED`.
This format is intended for webhook consumers that need structured data
rather than free text.
---
## NOTES AND LIMITATIONS
- All structural logic is evaluated on bar close
(`alert.freq_once_per_bar_close`). Intra-bar values may differ from the
final, confirmed reading.
- The Hull moving average is naturally smoother than EMA/SMA but still lags;
the slope-acceleration reading is the script's attempt to compensate, not
eliminate, that lag.
- Volume-based zone strength depends on the symbol providing usable volume
data. On instruments without reliable volume, strength values will be less
informative.
- The Confidence Score is a heuristic aid, not a probability. Different
markets and timeframes will live in different score ranges, and that is
expected.
---
## DISCLAIMER
This script is published for educational and informational purposes only. It
is not financial advice and does not guarantee any particular outcome. Past
behaviour of the indicator on historical data does not imply future
performance. Trade at your own risk and size positions according to your own
risk management.
Skrip open-source
Dengan semangat TradingView yang sesungguhnya, pembuat skrip ini telah menjadikannya sebagai sumber terbuka, sehingga para trader dapat meninjau dan memverifikasi fungsinya. Salut untuk penulisnya! Meskipun Anda dapat menggunakannya secara gratis, perlu diingat bahwa penerbitan ulang kode ini tunduk pada Tata Tertib kami.

Pernyataan Penyangkalan
Informasi dan publikasi ini tidak dimaksudkan, dan bukan merupakan, saran atau rekomendasi keuangan, investasi, trading, atau jenis lainnya yang diberikan atau didukung oleh TradingView. Baca selengkapnya di Ketentuan Penggunaan.
Skrip open-source
Dengan semangat TradingView yang sesungguhnya, pembuat skrip ini telah menjadikannya sebagai sumber terbuka, sehingga para trader dapat meninjau dan memverifikasi fungsinya. Salut untuk penulisnya! Meskipun Anda dapat menggunakannya secara gratis, perlu diingat bahwa penerbitan ulang kode ini tunduk pada Tata Tertib kami.
Pernyataan Penyangkalan
Informasi dan publikasi ini tidak dimaksudkan, dan bukan merupakan, saran atau rekomendasi keuangan, investasi, trading, atau jenis lainnya yang diberikan atau didukung oleh TradingView. Baca selengkapnya di Ketentuan Penggunaan.