OPEN-SOURCE SCRIPT
c-c/MA (Simplified 2-Color)
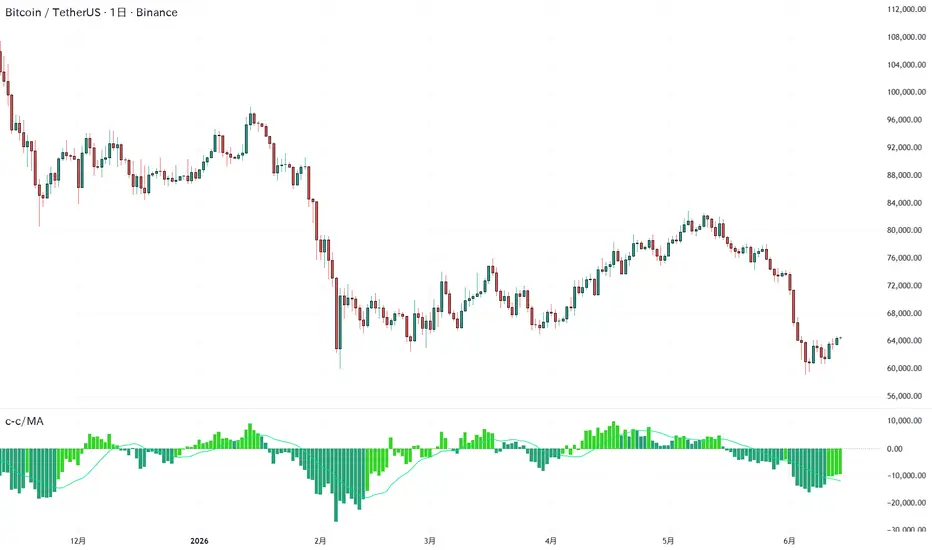
c-c/MA (Simplified 2-Color)
This indicator is a simple momentum analysis tool that visualizes price movement by comparing the current price with the price from a specified number of periods ago.
It displays the price difference as a histogram and applies a Simple Moving Average (SMA) to help identify trend strength and momentum shifts.
Features
Price Difference (c-c)
The indicator calculates the difference between the current closing price and the closing price from a specified number of bars ago:
* Positive values indicate that the current price is higher than the past price.
* Negative values indicate that the current price is lower than the past price.
SMA Smoothing
A Simple Moving Average (SMA) is applied to the histogram to smooth short-term fluctuations and highlight the overall momentum trend.
Two-Color Histogram
The histogram changes color based on its relationship to the SMA:
* Above SMA: Indicates relatively stronger momentum.
* Below SMA: Indicates weaker or slowing momentum.
Zero Line
The zero line represents the point where the current price equals the price from the selected lookback period:
* Above zero: Bullish momentum.
* Below zero: Bearish momentum.
How to Use
This indicator can be used to:
* Identify trend direction
* Evaluate momentum strength
* Detect potential trend shifts
* Complement other indicators such as RSI, volume analysis, or moving averages
Note: This indicator is designed as a supporting analytical tool and should be used alongside other forms of market analysis and risk management.
This indicator is a simple momentum analysis tool that visualizes price movement by comparing the current price with the price from a specified number of periods ago.
It displays the price difference as a histogram and applies a Simple Moving Average (SMA) to help identify trend strength and momentum shifts.
Features
Price Difference (c-c)
The indicator calculates the difference between the current closing price and the closing price from a specified number of bars ago:
* Positive values indicate that the current price is higher than the past price.
* Negative values indicate that the current price is lower than the past price.
SMA Smoothing
A Simple Moving Average (SMA) is applied to the histogram to smooth short-term fluctuations and highlight the overall momentum trend.
Two-Color Histogram
The histogram changes color based on its relationship to the SMA:
* Above SMA: Indicates relatively stronger momentum.
* Below SMA: Indicates weaker or slowing momentum.
Zero Line
The zero line represents the point where the current price equals the price from the selected lookback period:
* Above zero: Bullish momentum.
* Below zero: Bearish momentum.
How to Use
This indicator can be used to:
* Identify trend direction
* Evaluate momentum strength
* Detect potential trend shifts
* Complement other indicators such as RSI, volume analysis, or moving averages
Note: This indicator is designed as a supporting analytical tool and should be used alongside other forms of market analysis and risk management.
Skrip open-source
Dengan semangat TradingView yang sesungguhnya, pembuat skrip ini telah menjadikannya sebagai sumber terbuka, sehingga para trader dapat meninjau dan memverifikasi fungsinya. Salut untuk penulisnya! Meskipun Anda dapat menggunakannya secara gratis, perlu diingat bahwa penerbitan ulang kode ini tunduk pada Tata Tertib kami.

Pernyataan Penyangkalan
Informasi dan publikasi ini tidak dimaksudkan, dan bukan merupakan, saran atau rekomendasi keuangan, investasi, trading, atau jenis lainnya yang diberikan atau didukung oleh TradingView. Baca selengkapnya di Ketentuan Penggunaan.
Skrip open-source
Dengan semangat TradingView yang sesungguhnya, pembuat skrip ini telah menjadikannya sebagai sumber terbuka, sehingga para trader dapat meninjau dan memverifikasi fungsinya. Salut untuk penulisnya! Meskipun Anda dapat menggunakannya secara gratis, perlu diingat bahwa penerbitan ulang kode ini tunduk pada Tata Tertib kami.
Pernyataan Penyangkalan
Informasi dan publikasi ini tidak dimaksudkan, dan bukan merupakan, saran atau rekomendasi keuangan, investasi, trading, atau jenis lainnya yang diberikan atau didukung oleh TradingView. Baca selengkapnya di Ketentuan Penggunaan.