OPEN-SOURCE SCRIPT
Diupdate Volatility Drag Oscillator
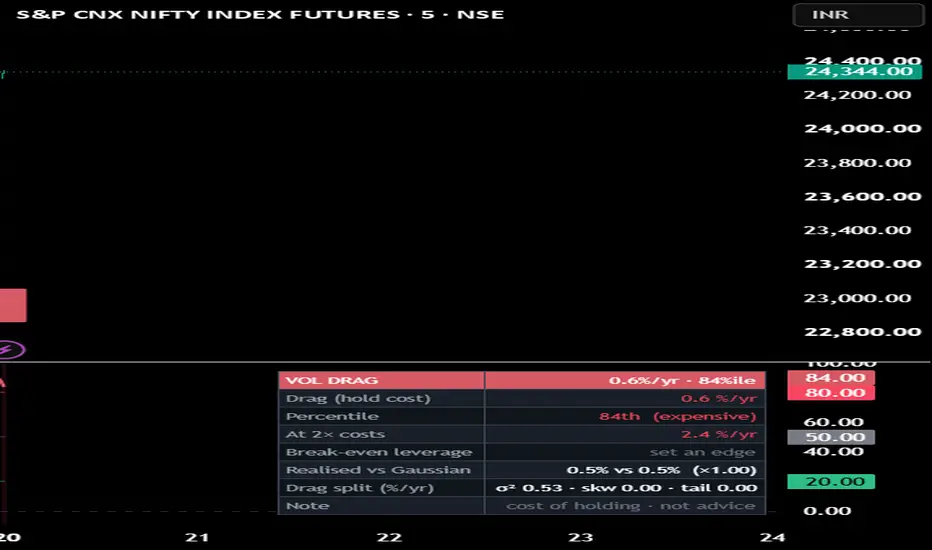
Volatility Drag Oscillator — what is holding exposure costing you, and what does leverage do to it?
Compound growth is g = μ − σ²/2; under leverage, g(L) = L·μ − L²·σ²/2. Return scales with L, drag scales
with L² — which is the whole reason leverage does not raise your probability of success. Volatility is
estimable in hundreds of bars; drift needs decades. So this tool measures only the knowable half:
- DRAG = σ²/2 annualised (Yang-Zhang by default; Close-to-close / Parkinson / Garman-Klass /
Rogers-Satchell selectable to see estimator disagreement = gap-risk information), EWMA-smoothed and
ranked into a percentile so you know if today is a cheap or expensive time to hold.
- DRAG DECOMPOSITION — realised drag split into its exact cumulant pieces: variance (σ²/2) + skew +
excess-kurtosis, shown as "σ² · skw · tail" in %/yr. A fat-tail warning tells you HOW MUCH of your
drag is tails, not just that they exist — and it compares realised drag to its own Gaussian part, so
it can't be fooled by estimator choice.
- LEVERAGE CURVE — drag at 1×/2×/3×, plus break-even L_be = 2μ/σ² and Kelly = μ/σ², shown ONLY as
conditionals on an edge YOU enter. The script never estimates drift, and says why.
READ IT how you like: a familiar 0-100 percentile OSCILLATOR in the pane (cheap<20, expensive>80,
midline 50, like an RSI of holding-cost), or the absolute drag %/yr line. On price, a heat-RIBBON and
green/red regime triangles show cheap→expensive to hold — VOLATILITY regime, direction-agnostic. A red
marker means "expensive, size down", never "go short".
No directional claim and no backtest — there is nothing here to fit. Descriptive risk context, not advice.
Leverage magnifies losses; this shows one cost of it, not all risks.
Compound growth is g = μ − σ²/2; under leverage, g(L) = L·μ − L²·σ²/2. Return scales with L, drag scales
with L² — which is the whole reason leverage does not raise your probability of success. Volatility is
estimable in hundreds of bars; drift needs decades. So this tool measures only the knowable half:
- DRAG = σ²/2 annualised (Yang-Zhang by default; Close-to-close / Parkinson / Garman-Klass /
Rogers-Satchell selectable to see estimator disagreement = gap-risk information), EWMA-smoothed and
ranked into a percentile so you know if today is a cheap or expensive time to hold.
- DRAG DECOMPOSITION — realised drag split into its exact cumulant pieces: variance (σ²/2) + skew +
excess-kurtosis, shown as "σ² · skw · tail" in %/yr. A fat-tail warning tells you HOW MUCH of your
drag is tails, not just that they exist — and it compares realised drag to its own Gaussian part, so
it can't be fooled by estimator choice.
- LEVERAGE CURVE — drag at 1×/2×/3×, plus break-even L_be = 2μ/σ² and Kelly = μ/σ², shown ONLY as
conditionals on an edge YOU enter. The script never estimates drift, and says why.
READ IT how you like: a familiar 0-100 percentile OSCILLATOR in the pane (cheap<20, expensive>80,
midline 50, like an RSI of holding-cost), or the absolute drag %/yr line. On price, a heat-RIBBON and
green/red regime triangles show cheap→expensive to hold — VOLATILITY regime, direction-agnostic. A red
marker means "expensive, size down", never "go short".
No directional claim and no backtest — there is nothing here to fit. Descriptive risk context, not advice.
Leverage magnifies losses; this shows one cost of it, not all risks.
Catatan Rilis
minor changeSkrip open-source
Dengan semangat TradingView yang sesungguhnya, pembuat skrip ini telah menjadikannya sebagai sumber terbuka, sehingga para trader dapat meninjau dan memverifikasi fungsinya. Salut untuk penulisnya! Meskipun Anda dapat menggunakannya secara gratis, perlu diingat bahwa penerbitan ulang kode ini tunduk pada Tata Tertib kami.

Pernyataan Penyangkalan
Informasi dan publikasi ini tidak dimaksudkan, dan bukan merupakan, saran atau rekomendasi keuangan, investasi, trading, atau jenis lainnya yang diberikan atau didukung oleh TradingView. Baca selengkapnya di Ketentuan Penggunaan.
Skrip open-source
Dengan semangat TradingView yang sesungguhnya, pembuat skrip ini telah menjadikannya sebagai sumber terbuka, sehingga para trader dapat meninjau dan memverifikasi fungsinya. Salut untuk penulisnya! Meskipun Anda dapat menggunakannya secara gratis, perlu diingat bahwa penerbitan ulang kode ini tunduk pada Tata Tertib kami.
Pernyataan Penyangkalan
Informasi dan publikasi ini tidak dimaksudkan, dan bukan merupakan, saran atau rekomendasi keuangan, investasi, trading, atau jenis lainnya yang diberikan atau didukung oleh TradingView. Baca selengkapnya di Ketentuan Penggunaan.