Diupdate
Auto Structure Fibonacci
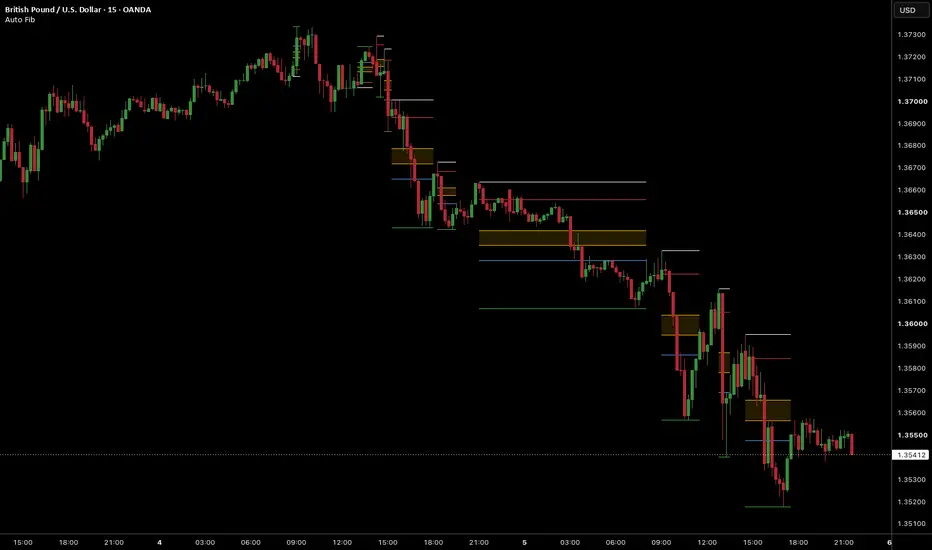
Auto Structure Fibonacci
Draws Fibonacci retracements automatically over completed market-structure legs, but only once price has shown a real pull-back. The aim is to recreate the Fibonaccis a trader would draw by hand on clear trending legs, without drawing a new one on every small swing.
How it works
1. Swing detection. The indicator uses a ZigZag based on ATR. A swing high is confirmed once price has fallen from it by ATR × multiplier (default 14 × 3.0). A swing low is confirmed the same way when price rises from it. Because it uses ATR, it adjusts to any instrument and timeframe.
2. Structure classification. Each swing is labelled as a Higher High, Lower High, Higher Low or Lower Low by comparing it with the previous swing of the same kind.
3. Leg selection.
• Bullish legs: LL → HH and HL → HH
• Bearish legs: HH → LL and LH → LL
Legs that end against the prevailing structure (for example LL → LH) are skipped. This avoids drawing a Fibonacci on every counter-trend bounce.
4. The 0.5 confirmation rule. This is what sets the script apart. A Fibonacci is not drawn when its leg is found. It appears only after price has pulled back to at least the 50% level. If price goes past the end of the leg first, the leg is dropped. This filters out legs the market never tested and leaves the ones where a real retracement happened.
5. Fixed levels. Once drawn, a Fibonacci never moves or changes. A set number of recent Fibonaccis stay on the chart (default 10), and the oldest is removed as new ones form.
What is drawn
Each Fibonacci has just four levels: 0, 0.5, 0.618 and 1. The area between 0.5 and 0.618 is shaded as a "gold zone". Level values are shown at the right-hand end of each line.
With default settings, nothing else is added to the chart. An optional **Show Swing Structure** setting displays the ZigZag and HH/HL/LH/LL labels, which helps when tuning.
Settings
• ATR Length and ATR Reversal Multiplier: how large a swing must be. Raise the multiplier for fewer, larger swings.
• Show or hide bullish and bearish Fibonaccis separately.
• Maximum number of Fibonaccis kept on the chart (1–100).
• How far the lines extend to the right, plus line width, style and colour for each level.
• Level values, with the price optionally included.
• Gold-zone shading on or off, with its colour and transparency.
Notes
• No repainting. Every decision is made on closed candles, and a swing is only used once it is confirmed. Historical Fibonaccis are exactly what the indicator would have drawn in real time.
• Because swings must be confirmed and then retraced, Fibonaccis appear with a delay. This is deliberate.
• The first leg of a reversal usually ends at a Lower High (or, for bearish legs, a Higher Low), so it is not drawn. The first Fibonacci typically appears on the following leg.
• Works on any timeframe and uses only the chart's own data.
This indicator is a visual tool for studying retracement zones. It does not generate trade signals and is not financial advice.
Draws Fibonacci retracements automatically over completed market-structure legs, but only once price has shown a real pull-back. The aim is to recreate the Fibonaccis a trader would draw by hand on clear trending legs, without drawing a new one on every small swing.
How it works
1. Swing detection. The indicator uses a ZigZag based on ATR. A swing high is confirmed once price has fallen from it by ATR × multiplier (default 14 × 3.0). A swing low is confirmed the same way when price rises from it. Because it uses ATR, it adjusts to any instrument and timeframe.
2. Structure classification. Each swing is labelled as a Higher High, Lower High, Higher Low or Lower Low by comparing it with the previous swing of the same kind.
3. Leg selection.
• Bullish legs: LL → HH and HL → HH
• Bearish legs: HH → LL and LH → LL
Legs that end against the prevailing structure (for example LL → LH) are skipped. This avoids drawing a Fibonacci on every counter-trend bounce.
4. The 0.5 confirmation rule. This is what sets the script apart. A Fibonacci is not drawn when its leg is found. It appears only after price has pulled back to at least the 50% level. If price goes past the end of the leg first, the leg is dropped. This filters out legs the market never tested and leaves the ones where a real retracement happened.
5. Fixed levels. Once drawn, a Fibonacci never moves or changes. A set number of recent Fibonaccis stay on the chart (default 10), and the oldest is removed as new ones form.
What is drawn
Each Fibonacci has just four levels: 0, 0.5, 0.618 and 1. The area between 0.5 and 0.618 is shaded as a "gold zone". Level values are shown at the right-hand end of each line.
With default settings, nothing else is added to the chart. An optional **Show Swing Structure** setting displays the ZigZag and HH/HL/LH/LL labels, which helps when tuning.
Settings
• ATR Length and ATR Reversal Multiplier: how large a swing must be. Raise the multiplier for fewer, larger swings.
• Show or hide bullish and bearish Fibonaccis separately.
• Maximum number of Fibonaccis kept on the chart (1–100).
• How far the lines extend to the right, plus line width, style and colour for each level.
• Level values, with the price optionally included.
• Gold-zone shading on or off, with its colour and transparency.
Notes
• No repainting. Every decision is made on closed candles, and a swing is only used once it is confirmed. Historical Fibonaccis are exactly what the indicator would have drawn in real time.
• Because swings must be confirmed and then retraced, Fibonaccis appear with a delay. This is deliberate.
• The first leg of a reversal usually ends at a Lower High (or, for bearish legs, a Higher Low), so it is not drawn. The first Fibonacci typically appears on the following leg.
• Works on any timeframe and uses only the chart's own data.
This indicator is a visual tool for studying retracement zones. It does not generate trade signals and is not financial advice.
Catatan Rilis
Auto Structure FibonacciDraws Fibonacci retracements automatically over completed market-structure legs, but only once price has shown a real pull-back. The aim is to recreate the Fibonaccis a trader would draw by hand on clear trending legs, without drawing a new one on every small swing.
HOW IT WORKS
1. Swing detection
The indicator uses a ZigZag based on ATR. A swing high is confirmed once price has fallen from it by ATR × multiplier (default 14 × 3.0). A swing low is confirmed the same way when price rises from it. Because it uses ATR, it adjusts to any instrument and timeframe.
2. Structure classification
Each swing is labelled as a Higher High, Lower High, Higher Low or Lower Low by comparing it with the previous swing of the same kind.
3. Leg selection
• Bullish legs: LL → HH and HL → HH
• Bearish legs: HH → LL and LH → LL
Legs that end against the prevailing structure (for example LL → LH) are skipped. This avoids drawing a Fibonacci on every counter-trend bounce.
4. The 0.5 confirmation rule
This is what sets the script apart. A Fibonacci is not drawn when its leg is found. It appears only after price has pulled back to at least the 50% level. If price goes past the end of the leg first, the leg is dropped. This filters out legs the market never tested and leaves the ones where a real retracement happened.
5. Fixed levels
Once drawn, a Fibonacci never moves or changes. A set number of recent Fibonaccis stay on the chart (default 10), and the oldest is removed as new ones form.
WHAT IS DRAWN
Each Fibonacci has just four levels: 0, 0.5, 0.618 and 1. The area between 0.5 and 0.618 is shaded as a "gold zone". Level values are shown at the right-hand end of each line.
With default settings, nothing else is added to the chart.
TUNING TOOLS (off by default)
• Show Swing Structure: displays the ZigZag and HH/HL/LH/LL labels, so you can see which swings the indicator has found. Hover over a label to see its price and how many bars later it was confirmed.
• ATR Display, Reversal Level: plots the price the current leg must reverse to before its swing is confirmed. The line sits below price in a rising leg and above price in a falling leg, and switches sides when a swing is confirmed. It shows directly why a pull-back did or didn't count as a swing.
• ATR Display, ATR Bands: close ± ATR × multiplier, for reference.
With either ATR option on, the ATR and reversal threshold values also appear in the Data Window.
SETTINGS
• ATR Length and ATR Reversal Multiplier: how large a swing must be. Raise the multiplier for fewer, larger swings, or lower it to catch smaller pull-backs in strong trends.
• Show or hide bullish and bearish Fibonaccis separately.
• Maximum number of Fibonaccis kept on the chart (1–100).
• How far the lines extend to the right, plus line width, style and colour for each level.
• Level values, with the price optionally included.
• Gold-zone shading on or off, with its colour and transparency.
NOTES
• No repainting. Every decision is made on closed candles, and a swing is only used once it is confirmed. Historical Fibonaccis are exactly what the indicator would have drawn in real time.
• Because swings must be confirmed and then retraced, Fibonaccis appear with a delay. This is deliberate.
• The first leg of a reversal usually ends at a Lower High (or, for bearish legs, a Higher Low), so it is not drawn. The first Fibonacci typically appears on the following leg.
• In fast trends with large candles, the ATR rises, so small pull-backs may not count as swings. Use the Reversal Level display to check, and lower the multiplier if needed.
• Works on any timeframe and uses only the chart's own data.
This indicator is a visual tool for studying retracement zones. It does not generate trade signals and is not financial advice.
Catatan Rilis
Auto Structure FibonacciDraws Fibonacci retracements automatically over completed market-structure legs, but only once price has shown a real pull-back. The aim is to recreate the Fibonaccis a trader would draw by hand on clear trending legs, without drawing a new one on every small swing.
HOW IT WORKS
1. Swing detection
The indicator uses a ZigZag based on ATR. A swing high is confirmed once price has fallen from it by ATR × multiplier (default 14 × 2.6). A swing low is confirmed the same way when price rises from it. Because it uses ATR, it adjusts to any instrument and timeframe.
2. Structure classification
Each swing is labelled as a Higher High, Lower High, Higher Low or Lower Low by comparing it with the previous swing of the same kind.
3. Leg selection
• Bullish legs: LL → HH and HL → HH
• Bearish legs: HH → LL and LH → LL
Legs that end against the prevailing structure (for example LL → LH) are skipped. This avoids drawing a Fibonacci on every counter-trend bounce.
4. The 0.5 confirmation rule
This is what sets the script apart. A Fibonacci is not drawn when its leg is found. It appears only after price has pulled back to at least the 50% level. If price goes past the end of the leg first, the leg is dropped. This filters out legs the market never tested and leaves the ones where a real retracement happened.
5. Fixed levels
Once drawn, a Fibonacci never moves or changes. A set number of recent Fibonaccis stay on the chart (default 10), and the oldest is removed as new ones form.
WHAT IS DRAWN
Each Fibonacci has just four levels: 0, 0.5, 0.618 and 1. The area between 0.5 and 0.618 is shaded as a "gold zone". Level values are shown at the right-hand end of each line.
With default settings, nothing else is added to the chart.
TUNING TOOLS (off by default)
• Show Swing Structure: displays the ZigZag and HH/HL/LH/LL labels, so you can see which swings the indicator has found. Hover over a label to see its price and how many bars later it was confirmed.
• ATR Display, Reversal Level: plots the price the current leg must reverse to before its swing is confirmed. The line sits below price in a rising leg and above price in a falling leg, and switches sides when a swing is confirmed. It shows directly why a pull-back did or didn't count as a swing.
• ATR Display, ATR Bands: close ± ATR × multiplier, for reference.
With either ATR option on, the ATR and reversal threshold values also appear in the Data Window.
SETTINGS
• ATR Length and ATR Reversal Multiplier: how large a swing must be. Raise the multiplier for fewer, larger swings, or lower it to catch smaller pull-backs in strong trends.
• Show or hide bullish and bearish Fibonaccis separately.
• Maximum number of Fibonaccis kept on the chart (1–100).
• How far the lines extend to the right, plus line width, style and colour for each level.
• Level values, with the price optionally included.
• Gold-zone shading on or off, with its colour and transparency.
NOTES
• No repainting. Every decision is made on closed candles, and a swing is only used once it is confirmed. Historical Fibonaccis are exactly what the indicator would have drawn in real time.
• Because swings must be confirmed and then retraced, Fibonaccis appear with a delay. This is deliberate.
• The first leg of a reversal usually ends at a Lower High (or, for bearish legs, a Higher Low), so it is not drawn. The first Fibonacci typically appears on the following leg.
• In fast trends with large candles, the ATR rises, so small pull-backs may not count as swings. Use the Reversal Level display to check, and lower the multiplier if needed.
• Works on any timeframe and uses only the chart's own data.
This indicator is a visual tool for studying retracement zones. It does not generate trade signals and is not financial advice.
Catatan Rilis
Auto Structure FibonacciDraws Fibonacci retracements automatically over completed market-structure moves, but only once price has shown a real pull-back. The aim is to recreate the Fibonaccis a trader would draw by hand on clear trending moves, without drawing a new one on every small swing.
HOW IT WORKS
A Fibonacci is never drawn when its move is found. It appears only after price has pulled back to a confirmation level. This filters out moves the market never tested and leaves the ones where a real retracement happened. Once drawn, a Fibonacci never moves or changes.
You can choose between two methods for deciding which moves get a Fibonacci.
Method 1: ATR ZigZag (default)
1. Swing detection
A swing high is confirmed once price has fallen from it by ATR × multiplier (default 14 × 2.6). A swing low is confirmed the same way when price rises from it. Because it uses ATR, it adjusts to any instrument and timeframe.
2. Structure classification
Each swing is labelled as a Higher High, Lower High, Higher Low or Lower Low by comparing it with the previous swing of the same kind. An optional Minimum Break setting requires a new high or low to beat the previous one by a set fraction of ATR before it counts as a Higher High or Lower Low. Smaller breaks are treated as equal highs or lows, which stops double tops, double bottoms and ranges from creating Fibonaccis.
3. Leg selection
• Bullish legs: LL → HH and HL → HH
• Bearish legs: HH → LL and LH → LL
Legs that end against the prevailing structure (for example LL → LH) are skipped. This avoids drawing a Fibonacci on every counter-trend bounce.
4. Confirmation
A leg's Fibonacci is drawn once price retraces to the confirmation level (default 0.5). If price goes past the end of the leg first, the leg is dropped.
Method 2: Retracement Chain
This method follows a trend as a chain of Fibonaccis, each one continuing the last. Using a downtrend as the example:
• After a bearish Fibonacci is drawn, the next one starts at the highest high of the pull-back that follows it.
• Price must then make a new low below the previous Fibonacci's 0. The lowest low reached becomes the new Fibonacci's 0.
• The new Fibonacci is drawn once price pulls back to the confirmation level (default 0.382).
• If price trades above the last bearish Fibonacci's 1, the chain is broken. The indicator then watches both directions, and whichever move reaches its confirmation level first is drawn and sets the new direction.
Uptrends work the same way in reverse.
Both methods keep a set number of recent Fibonaccis on the chart (default 10), and the oldest is removed as new ones form.
WHAT IS DRAWN
Each Fibonacci has just four levels: 0, 0.5, 0.618 and 1. The area between 0.5 and 0.618 is shaded as a "gold zone". Level values are shown at the right-hand end of each line.
With default settings, nothing else is added to the chart.
TUNING TOOLS (off by default)
These show the ATR ZigZag swings and apply to the ATR ZigZag method.
• Show Swing Structure: displays the ZigZag and HH/HL/LH/LL labels, so you can see which swings the indicator has found. Hover over a label to see its price and how many bars later it was confirmed.
• ATR Display, Reversal Level: plots the price the current leg must reverse to before its swing is confirmed. The line sits below price in a rising leg and above price in a falling leg, and switches sides when a swing is confirmed. It shows directly why a pull-back did or didn't count as a swing.
• ATR Display, ATR Bands: close ± ATR × multiplier, for reference.
With either ATR option on, the ATR and reversal threshold values also appear in the Data Window.
SETTINGS
• Structure Method: ATR ZigZag or Retracement Chain.
• Confirmation Level, set separately for each method: how far price must pull back before a Fibonacci is drawn.
• ATR Length and ATR Reversal Multiplier (ATR ZigZag): how large a swing must be. Raise the multiplier for fewer, larger swings, or lower it to catch smaller pull-backs in strong trends.
• Minimum Break × ATR (ATR ZigZag): how clearly a new high or low must break the previous one to count. 0 turns it off. Values around 0.25–0.5 are a good starting point.
• Show or hide bullish and bearish Fibonaccis separately.
• Maximum number of Fibonaccis kept on the chart (1–100).
• How far the lines extend to the right, plus line width, style and colour for each level.
• Level values, with the price optionally included.
• Gold-zone shading on or off, with its colour and transparency.
NOTES
• No repainting. Every decision is made on closed candles, and nothing is used before it is confirmed. Historical Fibonaccis are exactly what the indicator would have drawn in real time.
• Because moves must be confirmed and then retraced, Fibonaccis appear with a delay. This is deliberate.
• ATR ZigZag: the first leg of a reversal usually ends at a Lower High (or, for bearish legs, a Higher Low), so it is not drawn. The first Fibonacci typically appears on the following leg.
• ATR ZigZag: in fast trends with large candles, the ATR rises, so small pull-backs may not count as swings. Use the Reversal Level display to check, and lower the multiplier if needed.
• Retracement Chain: a new Fibonacci in the same direction needs a new extreme beyond the last one, followed by a pull-back to the confirmation level. A trend with only shallow pull-backs produces no new Fibonaccis until a pull-back is deep enough.
• Works on any timeframe and uses only the chart's own data.
This indicator is a visual tool for studying retracement zones. It does not generate trade signals and is not financial advice.
Catatan Rilis
Auto Structure FibonacciDraws Fibonacci retracements automatically over completed market-structure moves, but only once price has shown a real pull-back. The aim is to recreate the Fibonaccis a trader would draw by hand on clear trending moves, without drawing a new one on every small swing.
HOW IT WORKS
A Fibonacci is never drawn when its move is found. It appears only after price has pulled back to a confirmation level. This filters out moves the market never tested and leaves the ones where a real retracement happened. Once drawn, a Fibonacci never moves or changes.
You can choose between two methods for deciding which moves get a Fibonacci.
Method 1: ATR ZigZag (default)
1. Swing detection
A swing high is confirmed once price has fallen from it by ATR × multiplier (default 14 × 2.6). A swing low is confirmed the same way when price rises from it. Because it uses ATR, it adjusts to any instrument and timeframe.
2. Structure classification
Each swing is labelled as a Higher High, Lower High, Higher Low or Lower Low by comparing it with the previous swing of the same kind. An optional Minimum Break setting requires a new high or low to beat the previous one by a set fraction of ATR before it counts as a Higher High or Lower Low. Smaller breaks are treated as equal highs or lows, which stops double tops, double bottoms and ranges from creating Fibonaccis.
3. Leg selection
• Bullish legs: LL → HH and HL → HH
• Bearish legs: HH → LL and LH → LL
Legs that end against the prevailing structure (for example LL → LH) are skipped. This avoids drawing a Fibonacci on every counter-trend bounce.
4. Confirmation
A leg's Fibonacci is drawn once price retraces to the confirmation level (default 0.5). If price goes past the end of the leg first, the leg is dropped.
Method 2: Retracement Chain
This method follows a trend as a chain of Fibonaccis, each one continuing the last. Using a downtrend as the example:
• After a bearish Fibonacci is drawn, the next one starts at the highest high of the pull-back that follows it.
• Price must then make a new low below the previous Fibonacci's 0. The lowest low reached becomes the new Fibonacci's 0.
• The new Fibonacci is drawn once price pulls back to the confirmation level (default 0.382).
• If price trades above the last bearish Fibonacci's 1, the chain is broken. The indicator then watches both directions, and whichever move reaches its confirmation level first is drawn and sets the new direction.
Uptrends work the same way in reverse.
Both methods keep a set number of recent Fibonaccis on the chart (default 10), and the oldest is removed as new ones form.
WHAT IS DRAWN
Each Fibonacci has five levels: 0, 0.382, 0.5, 0.618 and 1 (the 0.382 level can be hidden). The area between 0.5 and 0.618 is shaded as a "gold zone". Level values are shown at the right-hand end of each line.
With default settings, nothing else is added to the chart.
TUNING TOOLS (off by default)
These show the ATR ZigZag swings and apply to the ATR ZigZag method.
• Show Swing Structure: displays the ZigZag and HH/HL/LH/LL labels, so you can see which swings the indicator has found. Hover over a label to see its price and how many bars later it was confirmed.
• ATR Display, Reversal Level: plots the price the current leg must reverse to before its swing is confirmed. The line sits below price in a rising leg and above price in a falling leg, and switches sides when a swing is confirmed. It shows directly why a pull-back did or didn't count as a swing.
• ATR Display, ATR Bands: close ± ATR × multiplier, for reference.
With either ATR option on, the ATR and reversal threshold values also appear in the Data Window.
SETTINGS
• Structure Method: ATR ZigZag or Retracement Chain.
• Confirmation Level, set separately for each method: how far price must pull back before a Fibonacci is drawn.
• ATR Length and ATR Reversal Multiplier (ATR ZigZag): how large a swing must be. Raise the multiplier for fewer, larger swings, or lower it to catch smaller pull-backs in strong trends.
• Minimum Break × ATR (ATR ZigZag): how clearly a new high or low must break the previous one to count. 0 turns it off. Values around 0.25–0.5 are a good starting point.
• Show or hide bullish and bearish Fibonaccis separately.
• Maximum number of Fibonaccis kept on the chart (1–80).
• How far the lines extend to the right, plus line width, style and colour for each level.
• Level values, with the price optionally included.
• Gold-zone shading on or off, with its colour and transparency.
NOTES
• No repainting. Every decision is made on closed candles, and nothing is used before it is confirmed. Historical Fibonaccis are exactly what the indicator would have drawn in real time.
• Because moves must be confirmed and then retraced, Fibonaccis appear with a delay. This is deliberate.
• ATR ZigZag: the first leg of a reversal usually ends at a Lower High (or, for bearish legs, a Higher Low), so it is not drawn. The first Fibonacci typically appears on the following leg.
• ATR ZigZag: in fast trends with large candles, the ATR rises, so small pull-backs may not count as swings. Use the Reversal Level display to check, and lower the multiplier if needed.
• Retracement Chain: a new Fibonacci in the same direction needs a new extreme beyond the last one, followed by a pull-back to the confirmation level. A trend with only shallow pull-backs produces no new Fibonaccis until a pull-back is deep enough.
• Works on any timeframe and uses only the chart's own data.
This indicator is a visual tool for studying retracement zones. It does not generate trade signals and is not financial advice.
Catatan Rilis
Auto Structure FibonacciDraws Fibonacci retracements automatically over completed market-structure moves, but only once price has shown a real pull-back. The aim is to recreate the Fibonaccis a trader would draw by hand on clear trending moves, without drawing a new one on every small swing.
HOW IT WORKS
A Fibonacci is never drawn when its move is found. It appears only after price has pulled back to a confirmation level. This filters out moves the market never tested and leaves the ones where a real retracement happened. Once drawn, a Fibonacci never moves or changes, and a new Fibonacci never starts before the previous one has finished.
You can choose between two methods for deciding which moves get a Fibonacci.
Method 1: ATR ZigZag (default)
1. Swing detection
A swing high is confirmed once price has fallen from it by ATR × multiplier (default 14 × 2.6). A swing low is confirmed the same way when price rises from it. Because it uses ATR, it adjusts to any instrument and timeframe.
2. Structure classification
Each swing is labelled as a Higher High, Lower High, Higher Low or Lower Low by comparing it with the previous swing of the same kind. An optional Minimum Break setting requires a new high or low to beat the previous one by a set fraction of ATR before it counts as a Higher High or Lower Low. Smaller breaks are treated as equal highs or lows, which stops double tops, double bottoms and ranges from creating Fibonaccis.
3. Leg selection
• Bullish legs: LL → HH and HL → HH
• Bearish legs: HH → LL and LH → LL
Legs that end against the prevailing structure (for example LL → LH) are skipped. This avoids drawing a Fibonacci on every counter-trend bounce.
4. Confirmation
A leg's Fibonacci is drawn once price retraces to the confirmation level (default 0.5). If price goes past the end of the leg first, the leg is dropped.
Method 2: Retracement Chain
This method follows a trend as a chain of Fibonaccis, each one continuing the last. Using a downtrend as the example:
• After a bearish Fibonacci is drawn, the next one starts at the highest high of the pull-back that follows it.
• Price must then make a new low below the previous Fibonacci's 0 (by at least Minimum Break × ATR, if set). The lowest low reached becomes the new Fibonacci's 0.
• The new Fibonacci is drawn once price pulls back to the confirmation level (default 0.382).
• If price trades above the last bearish Fibonacci's 1, the chain is broken. The indicator then watches both directions, and whichever move reaches its confirmation level first is drawn and sets the new direction.
Uptrends work the same way in reverse.
Both methods can hide small moves with Minimum Fibonacci Size (× ATR). In Retracement Chain, a hidden small move still counts as a link in the chain, so the chain behaves the same; it just isn't drawn. Both methods keep a set number of recent Fibonaccis on the chart (default 10), removing the oldest as new ones form.
WHAT IS DRAWN
Each Fibonacci has six levels: 0, 0.382, 0.5, 0.618, 0.86 and 1. The area between 0.5 and 0.618 is shaded as a "gold zone". The 0.382 and 0.86 levels can be hidden; 0.86 is a reference level only and does not affect when Fibonaccis are drawn. Level values are shown at the right-hand end of each line.
With default settings, nothing else is added to the chart.
TUNING TOOLS (off by default)
These show the ATR ZigZag swings, whichever method is selected.
• Show Swing Structure: displays the ZigZag joining the swings and a dashed line for the leg still forming.
• Show Swing Labels: displays HH/HL/LH/LL (and equal high/low) labels on the swings. Hover over a label to see its price and how many bars later it was confirmed.
• ATR Display, Reversal Level: plots the price the current leg must reverse to before its swing is confirmed. The line sits below price in a rising leg and above price in a falling leg, and switches sides when a swing is confirmed. It shows directly why a pull-back did or didn't count as a swing.
• ATR Display, ATR Bands: close ± ATR × multiplier, for reference.
With either ATR option on, the ATR and reversal threshold values also appear in the Data Window.
SETTINGS
• Structure Method: ATR ZigZag or Retracement Chain.
• Confirmation Level, set separately for each method: how far price must pull back before a Fibonacci is drawn.
• Minimum Fibonacci Size × ATR (both methods): the smallest move, from its 1 to its 0, that is drawn. 0 turns it off.
• ATR Length and ATR Reversal Multiplier (ATR ZigZag): how large a swing must be. Raise the multiplier for fewer, larger swings, or lower it to catch smaller pull-backs in strong trends.
• Minimum Break × ATR: how clearly a new high or low must break the previous one to count (ATR ZigZag), or how far a continuation must go beyond the previous Fibonacci's 0 (Retracement Chain). 0 turns it off. Values around 0.25–0.5 are a good starting point.
• Show or hide bullish and bearish Fibonaccis separately.
• Maximum number of Fibonaccis kept on the chart (1–50).
• How far the lines extend to the right, plus line width, style and colour for each level.
• Show or hide the 0.382 and 0.86 levels.
• Level values, with the price optionally included.
• Gold-zone shading on or off, with its colour and transparency.
NOTES
• No repainting. Every decision is made on closed candles, and nothing is used before it is confirmed. Historical Fibonaccis are exactly what the indicator would have drawn in real time.
• Because moves must be confirmed and then retraced, Fibonaccis appear with a delay. This is deliberate.
• ATR ZigZag: the first leg of a reversal usually ends at a Lower High (or, for bearish legs, a Higher Low), so it is not drawn. The first Fibonacci typically appears on the following leg.
• ATR ZigZag: in fast trends with large candles, the ATR rises, so small pull-backs may not count as swings. Use the Reversal Level display to check, and lower the multiplier if needed.
• Retracement Chain: a new Fibonacci in the same direction needs a new extreme beyond the last one, followed by a pull-back to the confirmation level. A trend with only shallow pull-backs produces no new Fibonaccis until a pull-back is deep enough.
• Works on any timeframe and uses only the chart's own data.
This indicator is a visual tool for studying retracement zones. It does not generate trade signals and is not financial advice.

Pernyataan Penyangkalan
Informasi dan publikasi ini tidak dimaksudkan, dan bukan merupakan, saran atau rekomendasi keuangan, investasi, trading, atau jenis lainnya yang diberikan atau didukung oleh TradingView. Baca selengkapnya di Ketentuan Penggunaan.
Pernyataan Penyangkalan
Informasi dan publikasi ini tidak dimaksudkan, dan bukan merupakan, saran atau rekomendasi keuangan, investasi, trading, atau jenis lainnya yang diberikan atau didukung oleh TradingView. Baca selengkapnya di Ketentuan Penggunaan.