EMMA SETUPS | Supply & Demand Volume Profile Pro
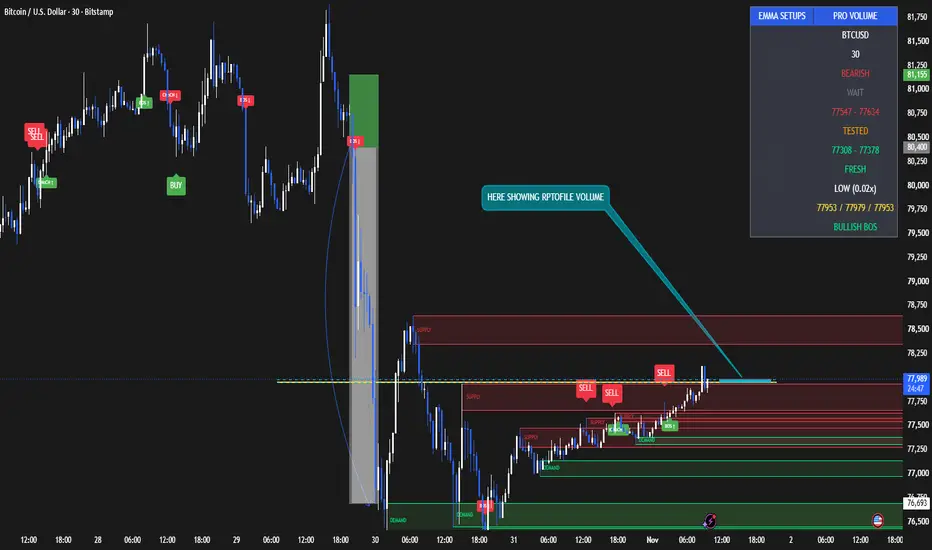
EMMA SETUPS – Supply & Demand Volume Profile Pro
Advanced Supply & Demand | Volume Profile | Market Structure | BUY & SELL Signals
**Developed by EMMA SETUPS**
EMMA SETUPS – Supply & Demand Volume Profile Pro is an advanced technical analysis indicator designed to help traders understand market structure, identify potential institutional supply and demand areas, and analyze volume distribution across different price levels.
This indicator combines multiple technical analysis concepts into one integrated system, providing a cleaner and more structured approach to market analysis.
It includes automatic Supply and Demand zone detection, Volume Profile calculations, POC, VAH, VAL, BOS, CHoCH, EMA trend confirmation, volume analysis, candle confirmation, BUY/SELL signals, and a professional real-time dashboard.
The goal is to help traders identify important market areas, understand market direction, and evaluate potential trading opportunities through multiple confirmations.
---
## 1. SUPPLY ZONE DETECTION
Supply Zones represent price areas where selling pressure may become stronger.
**How it works:**
- Uses Pivot High detection to identify potential resistance areas.
- Automatically calculates the Supply Zone using ATR-based zone thickness.
- Highlights the detected zone directly on the chart.
- Identifies whether the zone is fresh or has been tested.
**How to use it:**
When price approaches a Supply Zone, monitor bearish candle confirmation and volume activity for potential selling opportunities.
## 2. DEMAND ZONE DETECTION
Demand Zones represent price areas where buying pressure may increase.
**How it works:**
- Uses Pivot Low detection to identify potential support areas.
- Calculates zone boundaries using ATR.
- Automatically highlights Demand Zones.
- Tracks whether the zone is fresh or tested.
**How to use it:**
When price returns to a Demand Zone, monitor bullish candle confirmation and volume strength for potential buying opportunities.
## 3. VOLUME PROFILE ANALYSIS
The Volume Profile module analyzes estimated volume distribution across different price levels within the selected lookback period.
It helps traders understand where trading activity has been concentrated.
**Main Components:**
**POC – Point of Control**
The price level containing the highest estimated volume in the selected profile range.
**VAH – Value Area High**
The upper boundary of the Value Area, representing the upper portion of the selected volume distribution.
**VAL – Value Area Low**
The lower boundary of the Value Area, representing the lower portion of the selected volume distribution.
**Volume Distribution**
Displays volume across multiple price bins, helping traders identify areas of relatively high and low trading activity.
**How it works:**
The indicator divides the selected price range into multiple rows and distributes each candle's volume proportionally across its traded high-low range. It then calculates POC, VAH and VAL.
Note: This is an estimated candle-range volume profile, not true exchange-level tick-by-tick Volume Profile data.
## 4. MARKET STRUCTURE – BOS & CHoCH
The Market Structure module identifies potential changes and continuations in market direction.
**BOS – Break of Structure**
- Bullish BOS: Price breaks above the previous confirmed swing high.
- Bearish BOS: Price breaks below the previous confirmed swing low.
**CHoCH – Change of Character**
- Bullish CHoCH: Price breaks above a previous swing high while the previous structure direction was bearish.
- Bearish CHoCH: Price breaks below a previous swing low while the previous structure direction was bullish.
**How to use it:**
BOS can help identify potential trend continuation, while CHoCH can highlight a possible change in market direction.
## 5. EMA TREND FILTER
The indicator uses two Exponential Moving Averages:
- Fast EMA: 50 Period.
- Slow EMA: 200 Period.
**Bullish Trend:** Fast EMA is above Slow EMA.
**Bearish Trend:** Fast EMA is below Slow EMA.
**How it works:**
The EMA filter helps determine the overall trend direction and acts as a confirmation requirement for BUY and SELL signals.
The EMA lines can be displayed or hidden through the settings.
## 6. VOLUME STRENGTH ANALYSIS
Volume Strength compares the current candle's volume with its average volume.
**Volume Conditions:**
- HIGH: Volume is equal to or greater than the configured confirmation multiplier.
- NORMAL: Volume is above 80% of average volume but below the HIGH threshold.
- LOW: Volume is below 80% of average volume.
**How it works:**
The indicator calculates the ratio between current volume and its moving average.
This helps traders evaluate whether a potential market reaction is accompanied by relatively strong or weak volume.
## 7. BUY & SELL SIGNAL SYSTEM
The indicator uses multiple confirmation conditions before displaying trading signals.
**BUY Conditions:**
1. Price interacts with the latest detected Demand Zone.
2. Bullish candle confirmation appears.
3. Current volume meets the configured volume threshold.
4. Fast EMA is above Slow EMA.
When all conditions are satisfied, a BUY signal is displayed.
**SELL Conditions:**
1. Price interacts with the latest detected Supply Zone.
2. Bearish candle confirmation appears.
3. Current volume meets the configured volume threshold.
4. Fast EMA is below Slow EMA.
Advanced Supply & Demand | Volume Profile | Market Structure | BUY & SELL Signals
**Developed by EMMA SETUPS**
EMMA SETUPS – Supply & Demand Volume Profile Pro is an advanced technical analysis indicator designed to help traders understand market structure, identify potential institutional supply and demand areas, and analyze volume distribution across different price levels.
This indicator combines multiple technical analysis concepts into one integrated system, providing a cleaner and more structured approach to market analysis.
It includes automatic Supply and Demand zone detection, Volume Profile calculations, POC, VAH, VAL, BOS, CHoCH, EMA trend confirmation, volume analysis, candle confirmation, BUY/SELL signals, and a professional real-time dashboard.
The goal is to help traders identify important market areas, understand market direction, and evaluate potential trading opportunities through multiple confirmations.
---
## 1. SUPPLY ZONE DETECTION
Supply Zones represent price areas where selling pressure may become stronger.
**How it works:**
- Uses Pivot High detection to identify potential resistance areas.
- Automatically calculates the Supply Zone using ATR-based zone thickness.
- Highlights the detected zone directly on the chart.
- Identifies whether the zone is fresh or has been tested.
**How to use it:**
When price approaches a Supply Zone, monitor bearish candle confirmation and volume activity for potential selling opportunities.
## 2. DEMAND ZONE DETECTION
Demand Zones represent price areas where buying pressure may increase.
**How it works:**
- Uses Pivot Low detection to identify potential support areas.
- Calculates zone boundaries using ATR.
- Automatically highlights Demand Zones.
- Tracks whether the zone is fresh or tested.
**How to use it:**
When price returns to a Demand Zone, monitor bullish candle confirmation and volume strength for potential buying opportunities.
## 3. VOLUME PROFILE ANALYSIS
The Volume Profile module analyzes estimated volume distribution across different price levels within the selected lookback period.
It helps traders understand where trading activity has been concentrated.
**Main Components:**
**POC – Point of Control**
The price level containing the highest estimated volume in the selected profile range.
**VAH – Value Area High**
The upper boundary of the Value Area, representing the upper portion of the selected volume distribution.
**VAL – Value Area Low**
The lower boundary of the Value Area, representing the lower portion of the selected volume distribution.
**Volume Distribution**
Displays volume across multiple price bins, helping traders identify areas of relatively high and low trading activity.
**How it works:**
The indicator divides the selected price range into multiple rows and distributes each candle's volume proportionally across its traded high-low range. It then calculates POC, VAH and VAL.
Note: This is an estimated candle-range volume profile, not true exchange-level tick-by-tick Volume Profile data.
## 4. MARKET STRUCTURE – BOS & CHoCH
The Market Structure module identifies potential changes and continuations in market direction.
**BOS – Break of Structure**
- Bullish BOS: Price breaks above the previous confirmed swing high.
- Bearish BOS: Price breaks below the previous confirmed swing low.
**CHoCH – Change of Character**
- Bullish CHoCH: Price breaks above a previous swing high while the previous structure direction was bearish.
- Bearish CHoCH: Price breaks below a previous swing low while the previous structure direction was bullish.
**How to use it:**
BOS can help identify potential trend continuation, while CHoCH can highlight a possible change in market direction.
## 5. EMA TREND FILTER
The indicator uses two Exponential Moving Averages:
- Fast EMA: 50 Period.
- Slow EMA: 200 Period.
**Bullish Trend:** Fast EMA is above Slow EMA.
**Bearish Trend:** Fast EMA is below Slow EMA.
**How it works:**
The EMA filter helps determine the overall trend direction and acts as a confirmation requirement for BUY and SELL signals.
The EMA lines can be displayed or hidden through the settings.
## 6. VOLUME STRENGTH ANALYSIS
Volume Strength compares the current candle's volume with its average volume.
**Volume Conditions:**
- HIGH: Volume is equal to or greater than the configured confirmation multiplier.
- NORMAL: Volume is above 80% of average volume but below the HIGH threshold.
- LOW: Volume is below 80% of average volume.
**How it works:**
The indicator calculates the ratio between current volume and its moving average.
This helps traders evaluate whether a potential market reaction is accompanied by relatively strong or weak volume.
## 7. BUY & SELL SIGNAL SYSTEM
The indicator uses multiple confirmation conditions before displaying trading signals.
**BUY Conditions:**
1. Price interacts with the latest detected Demand Zone.
2. Bullish candle confirmation appears.
3. Current volume meets the configured volume threshold.
4. Fast EMA is above Slow EMA.
When all conditions are satisfied, a BUY signal is displayed.
**SELL Conditions:**
1. Price interacts with the latest detected Supply Zone.
2. Bearish candle confirmation appears.
3. Current volume meets the configured volume threshold.
4. Fast EMA is below Slow EMA.

t.me/+UhZW1s5FLGE0NDc0
we Provide Daily 3/5 Signals on XAUUSD / BTC
Join Our Telegram For More Update
we Provide Daily 3/5 Signals on XAUUSD / BTC
Join Our Telegram For More Update
Pernyataan Penyangkalan
Informasi dan publikasi ini tidak dimaksudkan, dan bukan merupakan, saran atau rekomendasi keuangan, investasi, trading, atau jenis lainnya yang diberikan atau didukung oleh TradingView. Baca selengkapnya di Ketentuan Penggunaan.
t.me/+UhZW1s5FLGE0NDc0
we Provide Daily 3/5 Signals on XAUUSD / BTC
Join Our Telegram For More Update
we Provide Daily 3/5 Signals on XAUUSD / BTC
Join Our Telegram For More Update
Pernyataan Penyangkalan
Informasi dan publikasi ini tidak dimaksudkan, dan bukan merupakan, saran atau rekomendasi keuangan, investasi, trading, atau jenis lainnya yang diberikan atau didukung oleh TradingView. Baca selengkapnya di Ketentuan Penggunaan.