OPEN-SOURCE SCRIPT
Vishal Trades Box Strategy
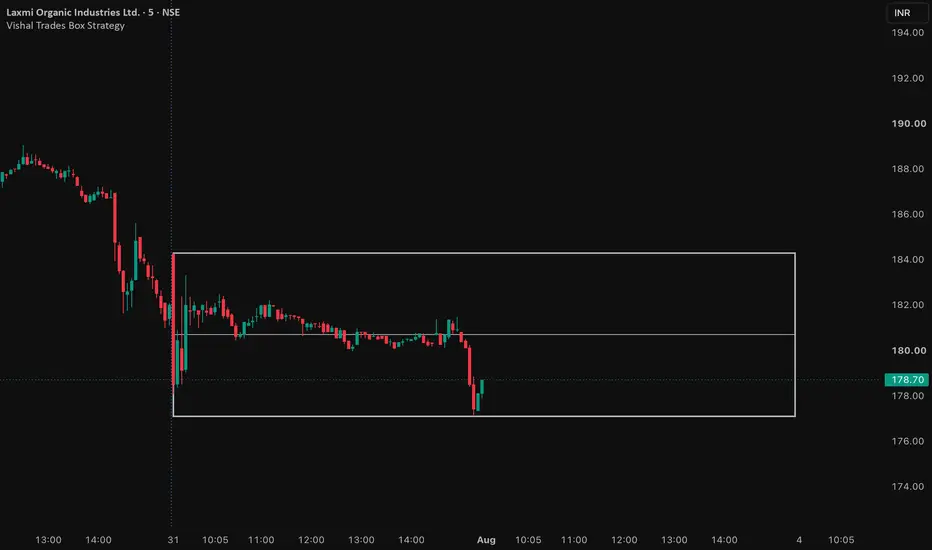
Vishal Trades Box Strategy
The Vishal Trades Box Strategy is a price action–based trading tool that automatically plots the previous trading session's High, Low, and Midpoint as a range box. The box is extended into the current trading session, allowing traders to identify key support, resistance, breakout, and rejection zones before the market opens.
By using the previous day's range, traders can quickly determine whether price is accepting or rejecting important levels, making it easier to plan high-probability entries, stop-loss placements, and profit targets. The strategy is designed to reduce chart clutter while keeping the most relevant market structure visible throughout the trading day.
Features:
Automatically plots the previous trading session's High and Low.
Draws the 50% midpoint of the previous day's range.
Extends the range into the current trading session.
Clean, lightweight, and non-repainting.
Works seamlessly on intraday timeframes.
Ideal for breakout, reversal, and range-bound trading strategies.
Suitable for stocks, indices, futures, and other liquid markets.
This indicator is built around the philosophy of keeping trading simple by focusing on important price levels rather than unnecessary indicators, helping traders make objective and disciplined trading decisions.
The Vishal Trades Box Strategy is a price action–based trading tool that automatically plots the previous trading session's High, Low, and Midpoint as a range box. The box is extended into the current trading session, allowing traders to identify key support, resistance, breakout, and rejection zones before the market opens.
By using the previous day's range, traders can quickly determine whether price is accepting or rejecting important levels, making it easier to plan high-probability entries, stop-loss placements, and profit targets. The strategy is designed to reduce chart clutter while keeping the most relevant market structure visible throughout the trading day.
Features:
Automatically plots the previous trading session's High and Low.
Draws the 50% midpoint of the previous day's range.
Extends the range into the current trading session.
Clean, lightweight, and non-repainting.
Works seamlessly on intraday timeframes.
Ideal for breakout, reversal, and range-bound trading strategies.
Suitable for stocks, indices, futures, and other liquid markets.
This indicator is built around the philosophy of keeping trading simple by focusing on important price levels rather than unnecessary indicators, helping traders make objective and disciplined trading decisions.
Skrip open-source
Dengan semangat TradingView yang sesungguhnya, pembuat skrip ini telah menjadikannya sebagai sumber terbuka, sehingga para trader dapat meninjau dan memverifikasi fungsinya. Salut untuk penulisnya! Meskipun Anda dapat menggunakannya secara gratis, perlu diingat bahwa penerbitan ulang kode ini tunduk pada Tata Tertib kami.

We Teach, You Trade.
youtube.com/@vishaltrades
youtube.com/@vishaltrades
Pernyataan Penyangkalan
Informasi dan publikasi ini tidak dimaksudkan, dan bukan merupakan, saran atau rekomendasi keuangan, investasi, trading, atau jenis lainnya yang diberikan atau didukung oleh TradingView. Baca selengkapnya di Ketentuan Penggunaan.
Skrip open-source
Dengan semangat TradingView yang sesungguhnya, pembuat skrip ini telah menjadikannya sebagai sumber terbuka, sehingga para trader dapat meninjau dan memverifikasi fungsinya. Salut untuk penulisnya! Meskipun Anda dapat menggunakannya secara gratis, perlu diingat bahwa penerbitan ulang kode ini tunduk pada Tata Tertib kami.
We Teach, You Trade.
youtube.com/@vishaltrades
youtube.com/@vishaltrades
Pernyataan Penyangkalan
Informasi dan publikasi ini tidak dimaksudkan, dan bukan merupakan, saran atau rekomendasi keuangan, investasi, trading, atau jenis lainnya yang diberikan atau didukung oleh TradingView. Baca selengkapnya di Ketentuan Penggunaan.