OPEN-SOURCE SCRIPT
Rescaled RSI [AdaptiveRSI]
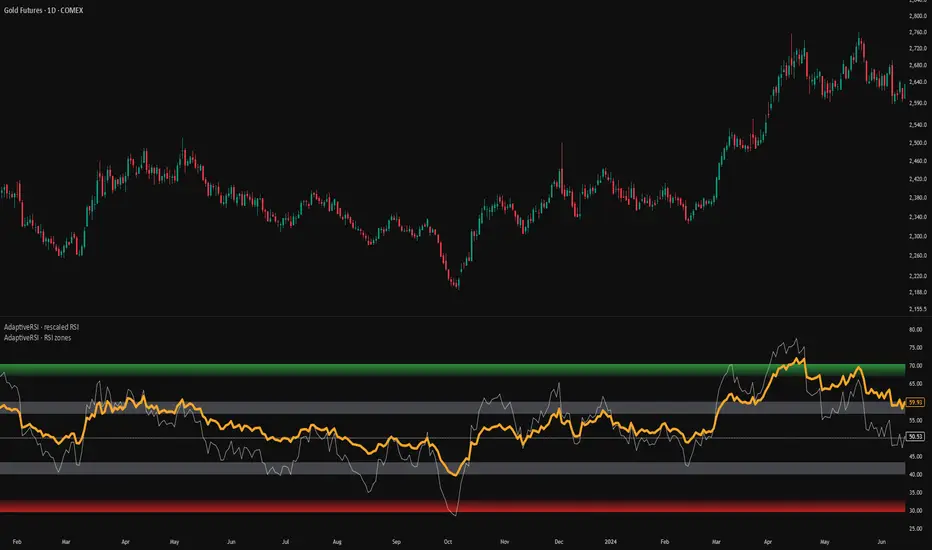
Plot multiple RSI lengths on the same calibrated scale and easily identify confluence signals. This tool rescales longer or shorter RSI values (e.g., RSI(70)) so they align with the thresholds of your primary RSI (such as RSI(14)), making signals consistent and comparable.
Most traders know that RSI(14) behaves differently from RSI(50), RSI(70), or RSI(200)… but very few understand why. The longer the lookback, the more compressed the movement — which means comparing different RSI settings directly is not only misleading, but mathematically invalid.
The fix was introduced in the RSI adaptive zones script. This indicator takes that idea further.
✦ ✦ ✦ ✦ ✦
💡 Why This Matters
Below is a screenshot of weekly RSI(14) plotted alongside daily RSI(14) with its adaptive zones. The main problem is that the weekly RSI value updates only on Friday’s close, so its readings miss most of the week’s price action.

Note that a weekly RSI(14) is mathematically equivalent to daily RSI(70):
5 days/week × 14 weeks = 70 days
So we can simply use a 70-period RSI and rescale it so it fits the 14-period scale. By doing this, we get an indicator that recalculates every bar, so we can spot true overextensions — not just Friday snapshots.

With Rescaled RSI, you can:
✔ Preview weekly signals directly on a daily chart
✔ Combine short-term timing with long-term context
✔ Detect confluence instead of guessing
✔ Use RSI the way it should scale across lookbacks
This is especially effective when combined with the 💡 RSI adaptive zones 💡 system — since the rescaled output aligns perfectly with statistically calibrated thresholds.
✦ ✦ ✦ ✦ ✦
💡 What This Indicator Does
Rescaled RSI takes any RSI length (e.g., RSI(70), RSI(2), RSI(200), etc.) and transforms it so it behaves like a standard RSI(14) — or any other chosen reference length — using a shared, statistically calibrated scale. This allows multiple RSI periods to be plotted together in a meaningful way, with signals aligned on the same exhaustion thresholds.
This method builds on the standardized RSI framework introduced in the RSI adaptive zones and consists of three steps:
That means:
✦ ✦ ✦ ✦ ✦
How to Use
1. Plot your preferred base RSI with Adaptive Zones (example: RSI(14))
2. Add the Rescaled RSI script in a second pane
3. Set the **Output Length** to match your primary RSI length
4. Drag the rescaled RSI onto the main pane
5. In the scale menu → Pin to scale A (the main RSI scale)

✦ ✦ ✦ ✦ ✦
Note: This framework describes statistical structure, not prediction. Use it as part of a complete trading approach. Past behavior does not guarantee future outcomes.
Attribution & License
This indicator incorporates:
• Logit transformation of RSI
• Variance scaling using 2/√(n−1)
• tanh inverse transform for mapping z-scores back into bounded RSI space
Released under CC BY-NC-SA 4.0 — free for non-commercial use with credit.
© AdaptiveRSI
Most traders know that RSI(14) behaves differently from RSI(50), RSI(70), or RSI(200)… but very few understand why. The longer the lookback, the more compressed the movement — which means comparing different RSI settings directly is not only misleading, but mathematically invalid.
The fix was introduced in the RSI adaptive zones script. This indicator takes that idea further.
✦ ✦ ✦ ✦ ✦
💡 Why This Matters
Below is a screenshot of weekly RSI(14) plotted alongside daily RSI(14) with its adaptive zones. The main problem is that the weekly RSI value updates only on Friday’s close, so its readings miss most of the week’s price action.
Note that a weekly RSI(14) is mathematically equivalent to daily RSI(70):
5 days/week × 14 weeks = 70 days
So we can simply use a 70-period RSI and rescale it so it fits the 14-period scale. By doing this, we get an indicator that recalculates every bar, so we can spot true overextensions — not just Friday snapshots.
With Rescaled RSI, you can:
✔ Preview weekly signals directly on a daily chart
✔ Combine short-term timing with long-term context
✔ Detect confluence instead of guessing
✔ Use RSI the way it should scale across lookbacks
This is especially effective when combined with the 💡 RSI adaptive zones 💡 system — since the rescaled output aligns perfectly with statistically calibrated thresholds.
✦ ✦ ✦ ✦ ✦
💡 What This Indicator Does
Rescaled RSI takes any RSI length (e.g., RSI(70), RSI(2), RSI(200), etc.) and transforms it so it behaves like a standard RSI(14) — or any other chosen reference length — using a shared, statistically calibrated scale. This allows multiple RSI periods to be plotted together in a meaningful way, with signals aligned on the same exhaustion thresholds.
This method builds on the standardized RSI framework introduced in the RSI adaptive zones and consists of three steps:
- Logit transform
Convert the input RSI(n) from its bounded 0–100 scale into an unbounded space using the logit function. - Variance normalization
Standardize the transformed values using the scaling factor 2/√(n−1) to produce a z-score. - Tanh-based rescaling
Map the z-score back into the bounded RSI space of the target (m) length using:
RSI(m) = 50 + 50 · tanh(z / √(m−1))
That means:
- A reading of RSI(70) becomes directly comparable to RSI(14)
- Signals appear at the same moment across lookbacks
- Multi-timeframe consistency becomes visible
- Both "compressed" long-lookback RSI and "overextended" short-lookback RSI become readable and actionable
✦ ✦ ✦ ✦ ✦
How to Use
1. Plot your preferred base RSI with Adaptive Zones (example: RSI(14))
2. Add the Rescaled RSI script in a second pane
3. Set the **Output Length** to match your primary RSI length
4. Drag the rescaled RSI onto the main pane
5. In the scale menu → Pin to scale A (the main RSI scale)
✦ ✦ ✦ ✦ ✦
Note: This framework describes statistical structure, not prediction. Use it as part of a complete trading approach. Past behavior does not guarantee future outcomes.
Attribution & License
This indicator incorporates:
• Logit transformation of RSI
• Variance scaling using 2/√(n−1)
• tanh inverse transform for mapping z-scores back into bounded RSI space
Released under CC BY-NC-SA 4.0 — free for non-commercial use with credit.
© AdaptiveRSI
Skrip open-source
Dengan semangat TradingView yang sesungguhnya, pembuat skrip ini telah menjadikannya sebagai sumber terbuka, sehingga para trader dapat meninjau dan memverifikasi fungsinya. Salut untuk penulisnya! Meskipun Anda dapat menggunakannya secara gratis, perlu diingat bahwa penerbitan ulang kode ini tunduk pada Tata Tertib kami.

New: "RSI Manifesto v2.0" — free 38-page download
adaptiversi.gumroad.com/l/evrgfw
Video tutorials:
youtube.com/@adaptiveRSI
adaptiversi.gumroad.com/l/evrgfw
Video tutorials:
youtube.com/@adaptiveRSI
Pernyataan Penyangkalan
Informasi dan publikasi ini tidak dimaksudkan, dan bukan merupakan, saran atau rekomendasi keuangan, investasi, trading, atau jenis lainnya yang diberikan atau didukung oleh TradingView. Baca selengkapnya di Ketentuan Penggunaan.
Skrip open-source
Dengan semangat TradingView yang sesungguhnya, pembuat skrip ini telah menjadikannya sebagai sumber terbuka, sehingga para trader dapat meninjau dan memverifikasi fungsinya. Salut untuk penulisnya! Meskipun Anda dapat menggunakannya secara gratis, perlu diingat bahwa penerbitan ulang kode ini tunduk pada Tata Tertib kami.
New: "RSI Manifesto v2.0" — free 38-page download
adaptiversi.gumroad.com/l/evrgfw
Video tutorials:
youtube.com/@adaptiveRSI
adaptiversi.gumroad.com/l/evrgfw
Video tutorials:
youtube.com/@adaptiveRSI
Pernyataan Penyangkalan
Informasi dan publikasi ini tidak dimaksudkan, dan bukan merupakan, saran atau rekomendasi keuangan, investasi, trading, atau jenis lainnya yang diberikan atau didukung oleh TradingView. Baca selengkapnya di Ketentuan Penggunaan.