Option Volume Profile
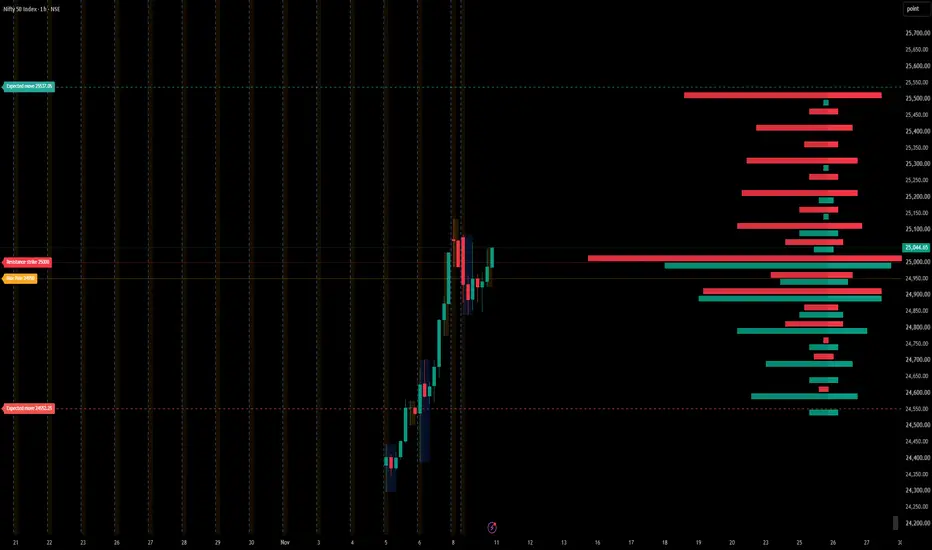
Option Volume Profile (Strike-Wise Call/Put Volume, Expected Move)
OVERVIEW
This indicator reads the option chain of an index or instrument directly from TradingView's data and draws a strike-wise profile on your chart: call volume and put volume for every strike around the current price, plus key levels derived from them. It is designed to give a quick visual read of where option activity is concentrated, without leaving the price chart.
Note: TradingView does not provide option open interest to Pine scripts, so this indicator uses traded option VOLUME per strike instead of open interest. Volume shows where trading activity happened today, not where open positions are held.
WHAT IT SHOWS
- Profile bars: call volume (red) and put volume (teal) for each strike, drawn to the right of the latest candle.
- Volume change: a thin strip next to each bar showing today's volume versus the previous day (solid = higher, faded = lower).
- Support strike: the strike with the highest put volume.
- Resistance strike: the strike with the highest call volume.
- Max Pain (volume-weighted): the strike where option buyers would lose the most at expiry, calculated with volume as the weight. This is an approximation of the classic open-interest-based max pain.
- Expected Move: current price plus/minus the at-the-money straddle price (ATM call + ATM put), using live option prices.
HOW IT WORKS
The script builds each option contract's symbol from the settings (exchange and root, expiry, strike and C/P), then requests the daily price and volume for every strike in the selected range. The centre strike is the one closest to the current price, and the chosen number of strikes is split evenly above and below it.
HOW TO USE
1. Add the indicator to your chart.
2. Option symbol: enter the exchange and root of the options, for example NSE:NIFTY (not the futures contract).
3. Expiry: enter the expiry date as YYMMDD, for example 261117 for 17 Nov 2026. Check the exact date in TradingView's options chain, as expiries can move because of holidays.
4. Strike step: enter the distance between strikes, for example 50 for NIFTY.
5. Strikes Count: choose how many strikes to show (up to 20).
6. If the profile is not visible, scroll the chart to the right or increase the right margin in chart settings, as the bars are drawn in the space to the right of the last candle.
If the settings do not match a listed contract, a message in the bottom-right corner shows the exact symbol the script tried, which makes it easy to correct the inputs.
NOTES AND LIMITATIONS
- Works only for options that TradingView lists and makes available to scripts. Test any new instrument by opening one of its option contracts in the symbol search.
- Volume is not open interest. Levels based on volume can differ from tools that use open interest, especially early in the session when volume is still building.
- The centre strike is fixed when the indicator loads. If price moves far during the day, change any setting to re-centre the profile.
- After an expiry passes, update the Expiry setting to the next contract.
- Uses up to 40 data requests (2 per strike), which is TradingView's limit per script.
CREDITS
Written in Pine Script v6 with the help of Claude, an AI assistant by Anthropic. I described the idea and Claude helped write, test and refine the code.
DISCLAIMER
This indicator is for educational and informational purposes only. It does not provide trading signals or financial advice. Option activity can change quickly and does not guarantee future price behaviour. Always do your own research and manage your risk.
OVERVIEW
This indicator reads the option chain of an index or instrument directly from TradingView's data and draws a strike-wise profile on your chart: call volume and put volume for every strike around the current price, plus key levels derived from them. It is designed to give a quick visual read of where option activity is concentrated, without leaving the price chart.
Note: TradingView does not provide option open interest to Pine scripts, so this indicator uses traded option VOLUME per strike instead of open interest. Volume shows where trading activity happened today, not where open positions are held.
WHAT IT SHOWS
- Profile bars: call volume (red) and put volume (teal) for each strike, drawn to the right of the latest candle.
- Volume change: a thin strip next to each bar showing today's volume versus the previous day (solid = higher, faded = lower).
- Support strike: the strike with the highest put volume.
- Resistance strike: the strike with the highest call volume.
- Max Pain (volume-weighted): the strike where option buyers would lose the most at expiry, calculated with volume as the weight. This is an approximation of the classic open-interest-based max pain.
- Expected Move: current price plus/minus the at-the-money straddle price (ATM call + ATM put), using live option prices.
HOW IT WORKS
The script builds each option contract's symbol from the settings (exchange and root, expiry, strike and C/P), then requests the daily price and volume for every strike in the selected range. The centre strike is the one closest to the current price, and the chosen number of strikes is split evenly above and below it.
HOW TO USE
1. Add the indicator to your chart.
2. Option symbol: enter the exchange and root of the options, for example NSE:NIFTY (not the futures contract).
3. Expiry: enter the expiry date as YYMMDD, for example 261117 for 17 Nov 2026. Check the exact date in TradingView's options chain, as expiries can move because of holidays.
4. Strike step: enter the distance between strikes, for example 50 for NIFTY.
5. Strikes Count: choose how many strikes to show (up to 20).
6. If the profile is not visible, scroll the chart to the right or increase the right margin in chart settings, as the bars are drawn in the space to the right of the last candle.
If the settings do not match a listed contract, a message in the bottom-right corner shows the exact symbol the script tried, which makes it easy to correct the inputs.
NOTES AND LIMITATIONS
- Works only for options that TradingView lists and makes available to scripts. Test any new instrument by opening one of its option contracts in the symbol search.
- Volume is not open interest. Levels based on volume can differ from tools that use open interest, especially early in the session when volume is still building.
- The centre strike is fixed when the indicator loads. If price moves far during the day, change any setting to re-centre the profile.
- After an expiry passes, update the Expiry setting to the next contract.
- Uses up to 40 data requests (2 per strike), which is TradingView's limit per script.
CREDITS
Written in Pine Script v6 with the help of Claude, an AI assistant by Anthropic. I described the idea and Claude helped write, test and refine the code.
DISCLAIMER
This indicator is for educational and informational purposes only. It does not provide trading signals or financial advice. Option activity can change quickly and does not guarantee future price behaviour. Always do your own research and manage your risk.

Pernyataan Penyangkalan
Informasi dan publikasi ini tidak dimaksudkan, dan bukan merupakan, saran atau rekomendasi keuangan, investasi, trading, atau jenis lainnya yang diberikan atau didukung oleh TradingView. Baca selengkapnya di Ketentuan Penggunaan.
Pernyataan Penyangkalan
Informasi dan publikasi ini tidak dimaksudkan, dan bukan merupakan, saran atau rekomendasi keuangan, investasi, trading, atau jenis lainnya yang diberikan atau didukung oleh TradingView. Baca selengkapnya di Ketentuan Penggunaan.