OPEN-SOURCE SCRIPT
Supertrend Tempered [Probalist Essentials]
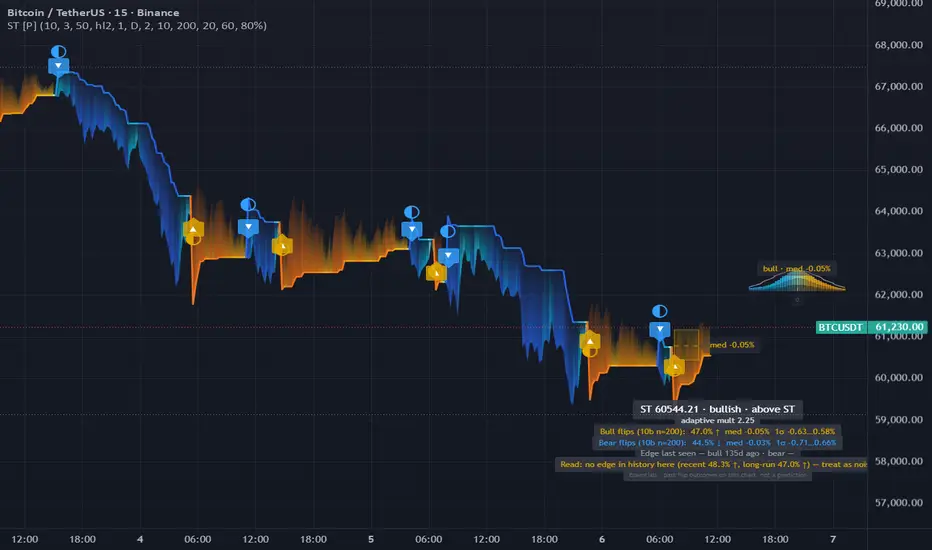
Supertrend Tempered is a trend-direction tool that places a trailing ATR stop above or below price and flips when price closes through it. Gold line means the trend is up; blue means it's down. The flip is the signal.
The Tempered version adds ATR-adaptive sensitivity so the band breathes with volatility — tighter when markets are calm, wider during spikes — reducing false flips without sacrificing responsiveness. On top of the classic, it tracks what actually happened after past flips on this chart and shows the distribution as a forward projection and a bell curve panel.
🟡 WHY THIS VERSION
A Supertrend that shows you what its own flips have historically led to, right on the chart. Most Supertrend scripts just draw the line and fire an alert — this one keeps score. After enough flips, the distribution panel and cone tell you the median outcome and the spread, separately for bull and bear flips, so you can judge the flip in context rather than treating every one the same. The adaptive mode is on by default because it cuts noise on most instruments without any extra fiddling. Flips only confirm on a closed bar so no midnight-print surprises. The alerts have a history-backed tier that fires only when your chart's past flips actually showed follow-through — a useful filter, not a promise.
🟡 HOW IT WORKS
The core is a two-sided trailing stop built from ATR. On each bar, a raw upper band sits above the midpoint by a multiple of ATR and a raw lower band sits below by the same amount. The bands are ratcheted: the upper band can only move down (or reset if price breaks above it), and the lower band can only move up (or reset if price breaks below it). When price closes above the upper band, trend flips to bullish and the lower band becomes the active trailing stop. When price closes below the lower band, trend flips to bearish and the upper band takes over.
In adaptive mode the multiplier is scaled by the ratio of short-term ATR to a longer-run ATR baseline. A high ratio means volatility is spiking relative to its norm — the band widens to avoid a false flip. A low ratio means conditions are quiet — the band tightens to stay close to price. The result tracks trend direction through choppy patches better than a fixed multiplier.
The probability read counts every confirmed flip, then looks up the close N bars later. Those returns go into per-direction arrays. The distribution panel draws a kernel-smoothed density of those returns, with a Gaussian overlay so you can see fat tails and skew at a glance. The projection cone after the most recent flip spans the 16th–84th percentile of that history, anchored at the flip price.
🟡 KEY FEATURES
🟡 HOW TO USE
🟡 PAIRS WELL WITH
A momentum read (RSI, MACD) pairs naturally here — a bullish Supertrend flip is worth more when momentum was oversold before the flip or is now turning up from a low base. A volume indicator adds the missing liquidity dimension: a flip on elevated volume has more conviction than one on thin air. For swing setups, a higher-timeframe structure read (S/R levels, swing highs/lows) tells you whether the flip is happening into open space or straight into overhead supply. The Supertrend alone doesn't read overextension — it just tracks the trend — so a volatility or mean-reversion tool alongside it flags when a quiet trend is tightening toward a potential squeeze release.
Supertrend Tempered gives you the classic ATR trailing stop with adaptive sensitivity and an honest historical context. It tells you which way the trend is running, how far price has moved through the band, and what past flips in that direction have actually produced on this chart. That's the read — what you do with it is yours.
Open source under MPL-2.0. The probability layer describes past signals on your chart — it is a measurement, not a prediction, and nothing here is financial advice.
The Tempered version adds ATR-adaptive sensitivity so the band breathes with volatility — tighter when markets are calm, wider during spikes — reducing false flips without sacrificing responsiveness. On top of the classic, it tracks what actually happened after past flips on this chart and shows the distribution as a forward projection and a bell curve panel.
🟡 WHY THIS VERSION
A Supertrend that shows you what its own flips have historically led to, right on the chart. Most Supertrend scripts just draw the line and fire an alert — this one keeps score. After enough flips, the distribution panel and cone tell you the median outcome and the spread, separately for bull and bear flips, so you can judge the flip in context rather than treating every one the same. The adaptive mode is on by default because it cuts noise on most instruments without any extra fiddling. Flips only confirm on a closed bar so no midnight-print surprises. The alerts have a history-backed tier that fires only when your chart's past flips actually showed follow-through — a useful filter, not a promise.
🟡 HOW IT WORKS
The core is a two-sided trailing stop built from ATR. On each bar, a raw upper band sits above the midpoint by a multiple of ATR and a raw lower band sits below by the same amount. The bands are ratcheted: the upper band can only move down (or reset if price breaks above it), and the lower band can only move up (or reset if price breaks below it). When price closes above the upper band, trend flips to bullish and the lower band becomes the active trailing stop. When price closes below the lower band, trend flips to bearish and the upper band takes over.
In adaptive mode the multiplier is scaled by the ratio of short-term ATR to a longer-run ATR baseline. A high ratio means volatility is spiking relative to its norm — the band widens to avoid a false flip. A low ratio means conditions are quiet — the band tightens to stay close to price. The result tracks trend direction through choppy patches better than a fixed multiplier.
The probability read counts every confirmed flip, then looks up the close N bars later. Those returns go into per-direction arrays. The distribution panel draws a kernel-smoothed density of those returns, with a Gaussian overlay so you can see fat tails and skew at a glance. The projection cone after the most recent flip spans the 16th–84th percentile of that history, anchored at the flip price.
🟡 KEY FEATURES
- ATR-adaptive multiplier that scales with short/long ATR ratio — fewer whipsaws in low-vol periods, wider band during spikes
- Clean ▲/▼ flip labels at each trend-change bar with hover tooltips showing signal strength and historical stats at fire time
- Weighted signal dots: size reflects excursion depth (ATR-scaled), glyph shows evidence tier at the moment of the flip
- Forward-return distribution: separate bull and bear outcome arrays, KDE bell curve panel with Gaussian overlay
- Projection cone anchored at the flip price, spanning the 16th–84th percentile of past outcomes in that direction
- Optional higher-timeframe Supertrend reference line — display only, no scoring or gating
- Heat colour ramp: line and fill breathe hot/cold with how far price has moved through the band
- Eight alert conditions including history-backed and strong-flip tiers, all confirmed on bar close
- Regime-aware reads: besides the long-run record, a recent-form window (default last 40 outcomes) with a Wilson-score evidence test — the Read tells you whether the signal works NOW, and an edge clock shows when each side last had it
🟡 HOW TO USE
- Use the line colour as a bias filter: gold = bullish bias, worth considering long-side setups; blue = bearish, consider the short side or stay flat.
- A flip label marks the moment the trend changed. Hover the dot to see the strength and what past flips at this signal tier averaged — use that as context, not a guarantee.
- ATR-adaptive mode is on by default. On trending instruments with variable volatility it cuts noise well. For very stable, range-bound markets you may prefer fixed multiplier.
- The projection cone after a flip shows the 16th–84th percentile of past outcomes in that direction, anchored at the flip price. A tight cone on a backed signal adds conviction; a wide or centred cone around zero is a caution.
- The distribution panel (top-right of the price pane) shows the full return distribution separately for bull and bear flips. The gap between the KDE fill and the Gaussian overlay reveals skew and fat tails.
- Run the optional HTF line to see whether the higher-timeframe trend agrees — a flip that aligns with the HTF direction has broader context; a counter-HTF flip is a fade candidate, not a trend trade.
- Realtime mode (Confirm bars = 0) updates the signal on the live bar — useful for watching; default 1-bar confirmation is the honest, non-repainting mode for alerts.
- Weigh the median move against your round-trip costs — a backed flip with a tiny median (say +0.04% on a 5-minute chart) doesn't survive fees and spread on most venues; the edge read is about direction, not net profit
🟡 PAIRS WELL WITH
A momentum read (RSI, MACD) pairs naturally here — a bullish Supertrend flip is worth more when momentum was oversold before the flip or is now turning up from a low base. A volume indicator adds the missing liquidity dimension: a flip on elevated volume has more conviction than one on thin air. For swing setups, a higher-timeframe structure read (S/R levels, swing highs/lows) tells you whether the flip is happening into open space or straight into overhead supply. The Supertrend alone doesn't read overextension — it just tracks the trend — so a volatility or mean-reversion tool alongside it flags when a quiet trend is tightening toward a potential squeeze release.
Supertrend Tempered gives you the classic ATR trailing stop with adaptive sensitivity and an honest historical context. It tells you which way the trend is running, how far price has moved through the band, and what past flips in that direction have actually produced on this chart. That's the read — what you do with it is yours.
Open source under MPL-2.0. The probability layer describes past signals on your chart — it is a measurement, not a prediction, and nothing here is financial advice.
Skrip open-source
Dengan semangat TradingView yang sesungguhnya, pembuat skrip ini telah menjadikannya sebagai sumber terbuka, sehingga para trader dapat meninjau dan memverifikasi fungsinya. Salut untuk penulisnya! Meskipun Anda dapat menggunakannya secara gratis, perlu diingat bahwa penerbitan ulang kode ini tunduk pada Tata Tertib kami.

Pernyataan Penyangkalan
Informasi dan publikasi ini tidak dimaksudkan, dan bukan merupakan, saran atau rekomendasi keuangan, investasi, trading, atau jenis lainnya yang diberikan atau didukung oleh TradingView. Baca selengkapnya di Ketentuan Penggunaan.
Skrip open-source
Dengan semangat TradingView yang sesungguhnya, pembuat skrip ini telah menjadikannya sebagai sumber terbuka, sehingga para trader dapat meninjau dan memverifikasi fungsinya. Salut untuk penulisnya! Meskipun Anda dapat menggunakannya secara gratis, perlu diingat bahwa penerbitan ulang kode ini tunduk pada Tata Tertib kami.
Pernyataan Penyangkalan
Informasi dan publikasi ini tidak dimaksudkan, dan bukan merupakan, saran atau rekomendasi keuangan, investasi, trading, atau jenis lainnya yang diberikan atau didukung oleh TradingView. Baca selengkapnya di Ketentuan Penggunaan.