OPEN-SOURCE SCRIPT
CVD Simple vs Oscillator
## CVD Simple vs Oscillator
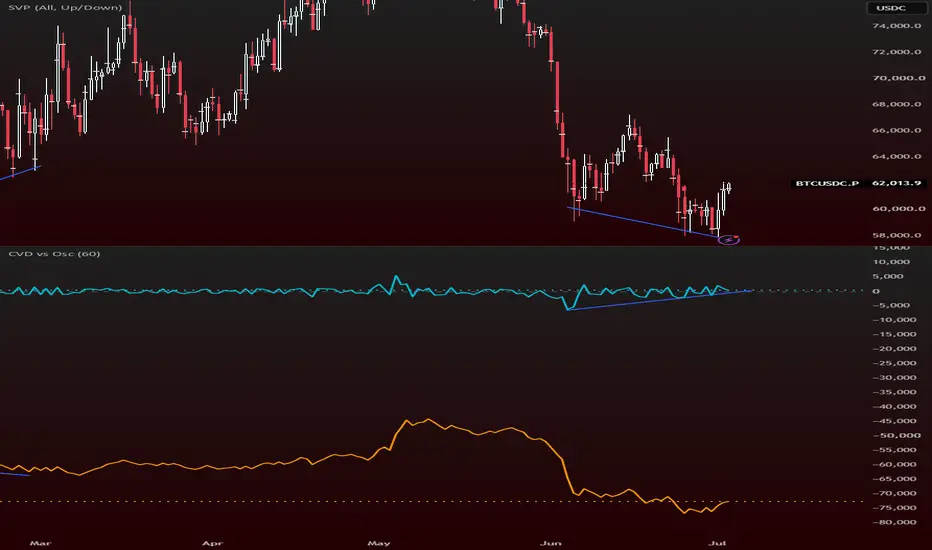
This indicator displays **two versions** of Cumulative Volume Delta side by side for easy comparison:
- **Simple CVD** (Orange): A basic volume delta calculation using close vs open.
- **Oscillator** (Aqua): An advanced, smoother version calculated using intrabar data via TradingView’s `requestVolumeDelta()` function.
### Key Features
- Dual CVD visualization (Simple + Advanced)
- Daily reset by default (resets at the start of each new day)
- Manual vertical scaling enabled (`scale = scale.none`) — drag the right-side scale to stretch the lines
- Clean zero line for easy reference
- Lightweight and easy to read
### How to Use
**Simple CVD (Orange)**
A quick and basic representation of net buying vs selling pressure. It can appear spiky on high-volume bars.
**Oscillator (Aqua)**
A more accurate and smoother representation of cumulative order flow. This is generally the better line to follow for analysis.
### How to Read the Indicator
- **Above zero** → Net buying pressure is dominant
- **Below zero** → Net selling pressure is dominant
- **Rising line** → Buyers are gaining control
- **Falling line** → Sellers are gaining control
### Recommended Usage
- Use the **Oscillator** (Aqua) line for better signals
- Best used on **15m to Daily** timeframes
- Works well for identifying **divergences** between price and volume pressure
- Combine with price action and key support/resistance levels
### Settings
- **Reset Period**: Choose how often the CVD resets (Default = Daily)
- You can manually stretch the vertical scale by dragging the numbers on the right side of the pane
### Notes
This indicator helps traders visualize the ongoing battle between buyers and sellers through cumulative volume delta. The Oscillator version provides a cleaner view compared to basic delta calculations.
This indicator displays **two versions** of Cumulative Volume Delta side by side for easy comparison:
- **Simple CVD** (Orange): A basic volume delta calculation using close vs open.
- **Oscillator** (Aqua): An advanced, smoother version calculated using intrabar data via TradingView’s `requestVolumeDelta()` function.
### Key Features
- Dual CVD visualization (Simple + Advanced)
- Daily reset by default (resets at the start of each new day)
- Manual vertical scaling enabled (`scale = scale.none`) — drag the right-side scale to stretch the lines
- Clean zero line for easy reference
- Lightweight and easy to read
### How to Use
**Simple CVD (Orange)**
A quick and basic representation of net buying vs selling pressure. It can appear spiky on high-volume bars.
**Oscillator (Aqua)**
A more accurate and smoother representation of cumulative order flow. This is generally the better line to follow for analysis.
### How to Read the Indicator
- **Above zero** → Net buying pressure is dominant
- **Below zero** → Net selling pressure is dominant
- **Rising line** → Buyers are gaining control
- **Falling line** → Sellers are gaining control
### Recommended Usage
- Use the **Oscillator** (Aqua) line for better signals
- Best used on **15m to Daily** timeframes
- Works well for identifying **divergences** between price and volume pressure
- Combine with price action and key support/resistance levels
### Settings
- **Reset Period**: Choose how often the CVD resets (Default = Daily)
- You can manually stretch the vertical scale by dragging the numbers on the right side of the pane
### Notes
This indicator helps traders visualize the ongoing battle between buyers and sellers through cumulative volume delta. The Oscillator version provides a cleaner view compared to basic delta calculations.
Skrip open-source
Dengan semangat TradingView yang sesungguhnya, pembuat skrip ini telah menjadikannya sebagai sumber terbuka, sehingga para trader dapat meninjau dan memverifikasi fungsinya. Salut untuk penulisnya! Meskipun Anda dapat menggunakannya secara gratis, perlu diingat bahwa penerbitan ulang kode ini tunduk pada Tata Tertib kami.

Pernyataan Penyangkalan
Informasi dan publikasi ini tidak dimaksudkan, dan bukan merupakan, saran atau rekomendasi keuangan, investasi, trading, atau jenis lainnya yang diberikan atau didukung oleh TradingView. Baca selengkapnya di Ketentuan Penggunaan.
Skrip open-source
Dengan semangat TradingView yang sesungguhnya, pembuat skrip ini telah menjadikannya sebagai sumber terbuka, sehingga para trader dapat meninjau dan memverifikasi fungsinya. Salut untuk penulisnya! Meskipun Anda dapat menggunakannya secara gratis, perlu diingat bahwa penerbitan ulang kode ini tunduk pada Tata Tertib kami.
Pernyataan Penyangkalan
Informasi dan publikasi ini tidak dimaksudkan, dan bukan merupakan, saran atau rekomendasi keuangan, investasi, trading, atau jenis lainnya yang diberikan atau didukung oleh TradingView. Baca selengkapnya di Ketentuan Penggunaan.