AH Beta v1
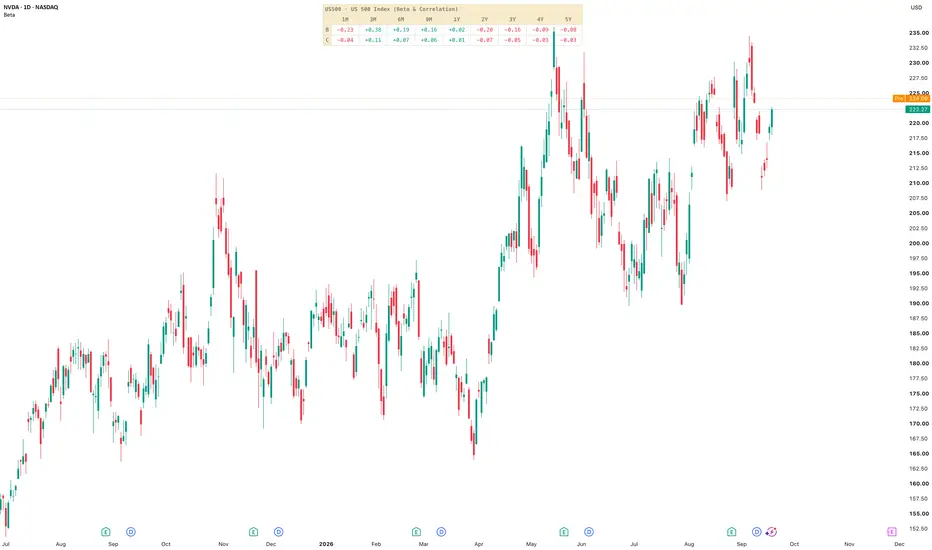
AH Beta compares an asset with a reference symbol across several fixed daily-bar windows. It places beta and return correlation together in a compact table, so you can see both the asset's historical sensitivity to the reference and the strength of their linear relationship.
AH Beta is a free, open-source indicator shared as a contribution to the TradingView community. It is part of the AH information and education series. The report brings standard beta and correlation calculations together across several horizons, using one selected reference and daily return observations. You can explore the source and adapt it to your own approach.
Why show more than one beta?
A beta value describes a particular comparison and sample. To interpret it, you need to know the reference, return frequency and observation period. A one-month estimate and a five-year estimate answer different questions; two providers can report different betas because their choices differ.
AH Beta makes those choices visible. The reference appears in the heading, calculations use daily prices, and each column identifies its model period. Short windows show recent relationships; longer windows provide a broader history. Comparing them can reveal changes in sensitivity and association, without assuming that any one window is the correct answer for every purpose.
The windows overlap. A difference between columns is descriptive evidence, not a statistical test of a regime change. Shorter samples are more sensitive to individual observations; longer samples can combine very different market conditions.
Reading the report
The heading identifies the reference and the report, for example US500 · US 500 Index (Beta & Correlation). The chart symbol is the asset being measured against that reference. Long reference descriptions are shortened on the chart; the heading tooltip identifies both symbols.
Columns show 1M, 3M, 6M, 9M, 1Y, 2Y, 3Y, 4Y and 5Y. All nine are enabled by default. These labels use a fixed convention: 21 daily bars per month and 252 daily bars per year.
• B — Beta: historical sensitivity of the asset's returns to the reference's returns.
• C — Correlation: Pearson correlation of the same paired returns, from −1 to +1.
• Green: a positive value. Red: a negative value. Blue: zero. These colors describe direction, not investment quality.
• Dash: an unavailable result. Hover to read the reason; missing results are not replaced with zero.
Values use two decimal places. Colors follow the underlying value, so a very small positive or negative result can round to zero while retaining its directional color.
Hover over B or C for the definition. Period and value tooltips show the required daily-bar count, date range and available observations. A short explanation appears if a result is unavailable. The heading tooltip identifies the asset, reference and date of the calculation.

Figure 1 — One asset, two references. Two instances of AH Beta compare Exxon Mobil (XOM) with US500 in the upper table and WTI crude oil (USOIL) in the lower table. Read the same period across both tables to see how beta and correlation differ with the selected reference.
To use this arrangement, add the indicator twice, choose a different Reference in each copy and give the tables separate Positions. This example shows another way to use the report: the asset stays the same while the comparison changes.
Beta and correlation measure different things
Beta is the slope of the historical linear relationship between asset and reference returns. It is calculated as:
Beta = covariance(asset returns, reference returns) / variance(reference returns)
A beta of +1.5 describes an estimated sensitivity of 1.5 percentage points in the asset's return for a one-percentage-point difference in the reference's return, within that sample's fitted relationship. It does not mean the asset moves exactly 1.5% whenever the reference moves 1%, and it is not a forecast.
Positive beta indicates a positive estimated relationship; negative beta indicates an inverse one. Beta is relative to the selected reference. It does not measure all of the asset's risk or guarantee that a negative-beta asset will hedge a future decline.
Correlation describes how closely the paired returns follow a linear relationship:
Correlation = covariance(asset returns, reference returns) / (asset return standard deviation × reference return standard deviation)
Values near +1 indicate a strong positive linear relationship; values near −1 indicate a strong inverse relationship. Values near zero indicate a weak linear relationship in the sample, not proof of independence or absence of all relationships.
For nonzero return variances, the formulas are connected:
Beta = correlation × (asset return standard deviation / reference return standard deviation)
This is why both rows matter. A beta of +2.0 alongside correlation of +0.25 describes positive sensitivity with weak linear association; it does not describe the same behavior as beta +2.0 alongside correlation +0.90. Nonzero beta and correlation calculated from the same observations have the same sign.
Daily data and bar counts
The calculation runs on the chart asset's daily bars. Switching to a five-minute or weekly chart changes the display interval, not the calculation into five-minute or weekly returns.
Reference daily prices are brought into that daily context using TradingView's normal bar mapping. The script does not build a separate list of common trading dates or adjust the sample length for weekends and holidays. When the reference has no new bar, the platform carries its available value forward. Repeated reference closes produce zero reference returns in the mapped series. The resulting comparison follows the asset's daily-bar sequence, so the mapped sample can differ when the two symbols are reversed.
Both beta and correlation use simple returns: close / previous close − 1. The prices are standard, regular-session and split-adjusted where provided. Dividends, risk-free-rate subtraction and currency conversion are not included. Each valid return observation receives equal weight.
The period convention
The model uses fixed counts rather than subtracting calendar dates:
• 1M: 21 daily bars.
• 3M: 63 daily bars.
• 6M: 126 daily bars.
• 9M: 189 daily bars.
• 1Y: 252 daily bars.
• 2Y: 504 daily bars.
• 3Y: 756 daily bars.
• 4Y: 1,008 daily bars.
• 5Y: 1,260 daily bars.
These are model labels, not a claim that every market has the same trading calendar. For example, 252 cryptocurrency daily bars cover a shorter calendar span than 252 weekday-market daily bars. The count stays fixed; the tooltip shows the dates actually covered by the asset's sample.
A 252-bar calculation uses 252 return observations and needs the preceding price to calculate the first return. It does not collect an extra calendar year's history or expand the window to replace invalid observations. If the selected window does not have the required valid returns, its result is unavailable.
If reference returns have zero variance, both beta and correlation are unavailable. If only asset returns are constant, beta is zero and correlation is unavailable. A missing or nonpositive price makes the affected return unavailable; zero price movement is a valid zero return.
Settings, in order
Data
Reference: US500 by default. Select another TradingView symbol to change the comparison. There is no automatic reference selection by asset class. Use a reference that fits the question you want to examine; US500 is a starting choice, not a universally appropriate benchmark. Providers using similar names can have different feeds and sessions, and a US500 CFD is not necessarily identical to a cash or total-return index.
Report
• Position: nine chart anchors; TopCenter by default.
• Text size: shared report size, default 12, adjustable from 8 to 20.
• Label color: B/C labels and unavailable values.
• Title color: reference and period-heading text.
• Background color: body background and transparency; transparent by default.
• Highlight color: reference heading, period headings and B/C label backgrounds; cream by default.
• Border color / Border width: internal cell lines; width 1 by default, adjustable from 0 to 5. Zero hides them.
• Frame color / Frame width: outer table frame; width 1 by default, adjustable from 0 to 5. Zero hides it.
The table is always present while the indicator is visible. Positive, negative and zero assessment colors remain fixed.
Periods
All nine periods are enabled initially. Turn off individual columns to make the report narrower. If every period is disabled, the table displays a reminder to select a period in Settings.
Exploring the open source
The source is organized into fixed period counts, formatting helpers, daily return statistics, report records, settings, data requests and table drawing. Comments explain the choices at each stage.
Window statistics use Pine's correlation and standard-deviation functions. Beta is calculated as correlation multiplied by the ratio of asset to reference return standard deviation, which is equivalent to covariance divided by reference variance. Both rows use the same returns and window. Beta is not smoothed, annualized or adjusted toward one. Correlation is bounded to −1 through +1 to contain floating-point rounding effects.
Data and interpretation
Results depend on provider history, revisions, symbol coverage and the selected reference. Returns remain in each symbol's native quote currency. Comparing symbols quoted in different currencies does not produce the returns of a portfolio converted into a single investor currency. The longest calculation requires 1,260 returns; the daily request includes a history allowance of 1,500 bars.
This is a current report, not a historical signal plot or backtest. A developing daily bar can update the results while markets are open. The data requests use lookahead off, and the report follows the daily data available through the platform. Session hours and feed updates can affect which reference price is available on a given asset bar.
Beta and correlation summarize past observations. Outliers and changing relationships can affect both. The report does not provide buy/sell signals, alerts, price targets, a combined score or a probability of future performance. It is an information and education tool, not investment advice.
AH Beta is a free, open-source indicator shared as a contribution to the TradingView community. It is part of the AH information and education series. The report brings standard beta and correlation calculations together across several horizons, using one selected reference and daily return observations. You can explore the source and adapt it to your own approach.
Why show more than one beta?
A beta value describes a particular comparison and sample. To interpret it, you need to know the reference, return frequency and observation period. A one-month estimate and a five-year estimate answer different questions; two providers can report different betas because their choices differ.
AH Beta makes those choices visible. The reference appears in the heading, calculations use daily prices, and each column identifies its model period. Short windows show recent relationships; longer windows provide a broader history. Comparing them can reveal changes in sensitivity and association, without assuming that any one window is the correct answer for every purpose.
The windows overlap. A difference between columns is descriptive evidence, not a statistical test of a regime change. Shorter samples are more sensitive to individual observations; longer samples can combine very different market conditions.
Reading the report
The heading identifies the reference and the report, for example US500 · US 500 Index (Beta & Correlation). The chart symbol is the asset being measured against that reference. Long reference descriptions are shortened on the chart; the heading tooltip identifies both symbols.
Columns show 1M, 3M, 6M, 9M, 1Y, 2Y, 3Y, 4Y and 5Y. All nine are enabled by default. These labels use a fixed convention: 21 daily bars per month and 252 daily bars per year.
• B — Beta: historical sensitivity of the asset's returns to the reference's returns.
• C — Correlation: Pearson correlation of the same paired returns, from −1 to +1.
• Green: a positive value. Red: a negative value. Blue: zero. These colors describe direction, not investment quality.
• Dash: an unavailable result. Hover to read the reason; missing results are not replaced with zero.
Values use two decimal places. Colors follow the underlying value, so a very small positive or negative result can round to zero while retaining its directional color.
Hover over B or C for the definition. Period and value tooltips show the required daily-bar count, date range and available observations. A short explanation appears if a result is unavailable. The heading tooltip identifies the asset, reference and date of the calculation.
Figure 1 — One asset, two references. Two instances of AH Beta compare Exxon Mobil (XOM) with US500 in the upper table and WTI crude oil (USOIL) in the lower table. Read the same period across both tables to see how beta and correlation differ with the selected reference.
To use this arrangement, add the indicator twice, choose a different Reference in each copy and give the tables separate Positions. This example shows another way to use the report: the asset stays the same while the comparison changes.
Beta and correlation measure different things
Beta is the slope of the historical linear relationship between asset and reference returns. It is calculated as:
Beta = covariance(asset returns, reference returns) / variance(reference returns)
A beta of +1.5 describes an estimated sensitivity of 1.5 percentage points in the asset's return for a one-percentage-point difference in the reference's return, within that sample's fitted relationship. It does not mean the asset moves exactly 1.5% whenever the reference moves 1%, and it is not a forecast.
Positive beta indicates a positive estimated relationship; negative beta indicates an inverse one. Beta is relative to the selected reference. It does not measure all of the asset's risk or guarantee that a negative-beta asset will hedge a future decline.
Correlation describes how closely the paired returns follow a linear relationship:
Correlation = covariance(asset returns, reference returns) / (asset return standard deviation × reference return standard deviation)
Values near +1 indicate a strong positive linear relationship; values near −1 indicate a strong inverse relationship. Values near zero indicate a weak linear relationship in the sample, not proof of independence or absence of all relationships.
For nonzero return variances, the formulas are connected:
Beta = correlation × (asset return standard deviation / reference return standard deviation)
This is why both rows matter. A beta of +2.0 alongside correlation of +0.25 describes positive sensitivity with weak linear association; it does not describe the same behavior as beta +2.0 alongside correlation +0.90. Nonzero beta and correlation calculated from the same observations have the same sign.
Daily data and bar counts
The calculation runs on the chart asset's daily bars. Switching to a five-minute or weekly chart changes the display interval, not the calculation into five-minute or weekly returns.
Reference daily prices are brought into that daily context using TradingView's normal bar mapping. The script does not build a separate list of common trading dates or adjust the sample length for weekends and holidays. When the reference has no new bar, the platform carries its available value forward. Repeated reference closes produce zero reference returns in the mapped series. The resulting comparison follows the asset's daily-bar sequence, so the mapped sample can differ when the two symbols are reversed.
Both beta and correlation use simple returns: close / previous close − 1. The prices are standard, regular-session and split-adjusted where provided. Dividends, risk-free-rate subtraction and currency conversion are not included. Each valid return observation receives equal weight.
The period convention
The model uses fixed counts rather than subtracting calendar dates:
• 1M: 21 daily bars.
• 3M: 63 daily bars.
• 6M: 126 daily bars.
• 9M: 189 daily bars.
• 1Y: 252 daily bars.
• 2Y: 504 daily bars.
• 3Y: 756 daily bars.
• 4Y: 1,008 daily bars.
• 5Y: 1,260 daily bars.
These are model labels, not a claim that every market has the same trading calendar. For example, 252 cryptocurrency daily bars cover a shorter calendar span than 252 weekday-market daily bars. The count stays fixed; the tooltip shows the dates actually covered by the asset's sample.
A 252-bar calculation uses 252 return observations and needs the preceding price to calculate the first return. It does not collect an extra calendar year's history or expand the window to replace invalid observations. If the selected window does not have the required valid returns, its result is unavailable.
If reference returns have zero variance, both beta and correlation are unavailable. If only asset returns are constant, beta is zero and correlation is unavailable. A missing or nonpositive price makes the affected return unavailable; zero price movement is a valid zero return.
Settings, in order
Data
Reference: US500 by default. Select another TradingView symbol to change the comparison. There is no automatic reference selection by asset class. Use a reference that fits the question you want to examine; US500 is a starting choice, not a universally appropriate benchmark. Providers using similar names can have different feeds and sessions, and a US500 CFD is not necessarily identical to a cash or total-return index.
Report
• Position: nine chart anchors; TopCenter by default.
• Text size: shared report size, default 12, adjustable from 8 to 20.
• Label color: B/C labels and unavailable values.
• Title color: reference and period-heading text.
• Background color: body background and transparency; transparent by default.
• Highlight color: reference heading, period headings and B/C label backgrounds; cream by default.
• Border color / Border width: internal cell lines; width 1 by default, adjustable from 0 to 5. Zero hides them.
• Frame color / Frame width: outer table frame; width 1 by default, adjustable from 0 to 5. Zero hides it.
The table is always present while the indicator is visible. Positive, negative and zero assessment colors remain fixed.
Periods
All nine periods are enabled initially. Turn off individual columns to make the report narrower. If every period is disabled, the table displays a reminder to select a period in Settings.
Exploring the open source
The source is organized into fixed period counts, formatting helpers, daily return statistics, report records, settings, data requests and table drawing. Comments explain the choices at each stage.
Window statistics use Pine's correlation and standard-deviation functions. Beta is calculated as correlation multiplied by the ratio of asset to reference return standard deviation, which is equivalent to covariance divided by reference variance. Both rows use the same returns and window. Beta is not smoothed, annualized or adjusted toward one. Correlation is bounded to −1 through +1 to contain floating-point rounding effects.
Data and interpretation
Results depend on provider history, revisions, symbol coverage and the selected reference. Returns remain in each symbol's native quote currency. Comparing symbols quoted in different currencies does not produce the returns of a portfolio converted into a single investor currency. The longest calculation requires 1,260 returns; the daily request includes a history allowance of 1,500 bars.
This is a current report, not a historical signal plot or backtest. A developing daily bar can update the results while markets are open. The data requests use lookahead off, and the report follows the daily data available through the platform. Session hours and feed updates can affect which reference price is available on a given asset bar.
Beta and correlation summarize past observations. Outliers and changing relationships can affect both. The report does not provide buy/sell signals, alerts, price targets, a combined score or a probability of future performance. It is an information and education tool, not investment advice.

Pernyataan Penyangkalan
Informasi dan publikasi ini tidak dimaksudkan, dan bukan merupakan, saran atau rekomendasi keuangan, investasi, trading, atau jenis lainnya yang diberikan atau didukung oleh TradingView. Baca selengkapnya di Ketentuan Penggunaan.
Pernyataan Penyangkalan
Informasi dan publikasi ini tidak dimaksudkan, dan bukan merupakan, saran atau rekomendasi keuangan, investasi, trading, atau jenis lainnya yang diberikan atau didukung oleh TradingView. Baca selengkapnya di Ketentuan Penggunaan.