IFVG + OB Backtesting Assistance
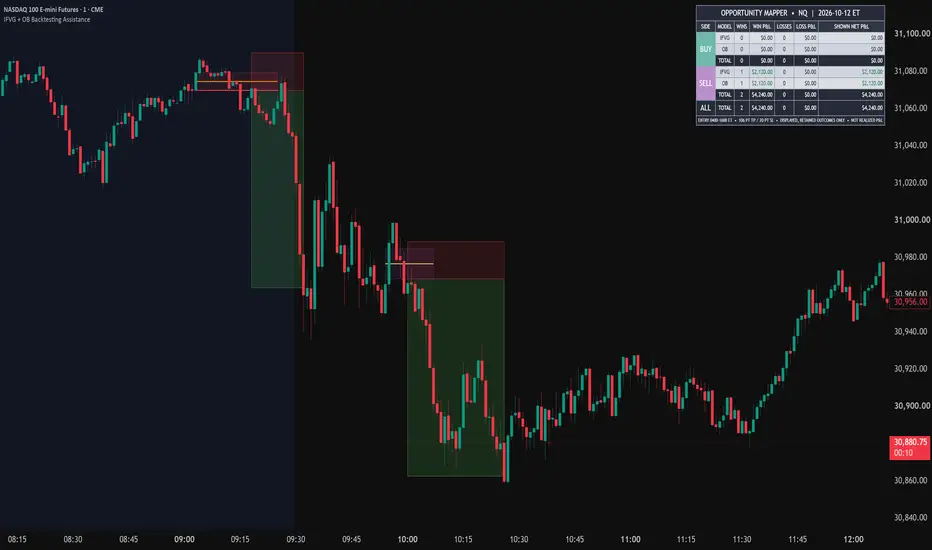
IFVG + OB Backtesting Assistant
## Overview
IFVG + OB Backtesting Assistant is a historical market-analysis indicator designed to identify, visualize, and evaluate trading opportunities originating from Inverse Fair Value Gaps (IFVGs) and Order Blocks (OBs).
The indicator combines two independent price-action models into a unified research environment, allowing traders to examine historical entry locations, originating price zones, and subsequent price behavior relative to configurable take-profit and stop-loss levels.
Its primary purpose is to facilitate retrospective opportunity analysis, visual backtesting, and systematic research into price-action setups.
## Methodology
**1. First-Active Inverse Fair Value Gap (IFVG)**
The IFVG model monitors the formation of fair value gaps and identifies qualifying inversions when price closes beyond the relevant gap boundary.
Once an eligible inverted zone is established, the model monitors the first qualifying interaction with the selected entry level.
Users can configure entry evaluation at either the zone boundary or Consequent Encroachment (the midpoint of the gap).
The model includes controls for minimum gap size, zone age, consecutive gap qualification, and invalidation.
**2. First-Active Order Block (OB)**
The Order Block model identifies qualifying groups of consecutive directional candles and evaluates subsequent displacement and price interaction.
The model applies configurable conditions involving candle-group structure, directional closes, displacement efficiency, and body size.
Qualifying Order Blocks are monitored for their first eligible entry interaction, subject to the selected validity conditions.
These models operate independently, allowing historical IFVG and OB opportunities to be examined separately or together.
## Historical Opportunity Visualization
The indicator preserves the originating price-zone coordinates associated with each identified opportunity.
Once a candidate reaches its configured take-profit or stop-loss level, the corresponding outcome can be displayed retrospectively at the original entry location.
Available visualization features include:
- Historical IFVG and Order Block source zones.
- Independent winning and losing opportunity displays.
- Optional take-profit and stop-loss visualization.
- Configurable zone boundaries and reference lines.
- Adjustable source-zone extensions.
- Optional price labels and zone identification tags.
Winning opportunities are enabled by default. Losing opportunities can be enabled independently for each model.
Text labels and identification tags are disabled by default to minimize chart congestion.
## Session Configuration
Both models use shared, customizable time windows.
- **State-Tracking Session:** Default **07:00–16:00**, New York time.
- **Entry/Validation Session:** Default **09:30–16:00**, New York time.
The state-tracking session determines when qualifying structures are monitored, while the entry session determines when candidate entries may be registered.
This arrangement supports the analysis of structures formed before the selected execution window.
The indicator is designed for use on the **1-minute chart**.
## Daily Opportunity Analytics
An integrated daily performance table summarizes historical opportunity outcomes separately for bullish and bearish IFVG and OB models.
The table includes:
- Winning opportunities and modeled winning P&L.
- Losing opportunities and modeled losing P&L.
- Combined displayed net P&L.
- Individual model and directional breakdowns.
Users can configure the target distance, stop-loss distance, contract quantity, and monetary value per point.
The calculations represent hypothetical outcomes based on the selected parameters, not verified brokerage transactions.
The table counts retained, displayed outcomes. Disabling opportunity categories or reaching historical drawing limits can affect the reported totals.
## Important Limitations
**This is a retrospective opportunity-analysis indicator, not an automated trading strategy.**
Historical opportunity zones and markers are displayed after their associated outcomes become known. They may be drawn backward onto the original entry candles and must not be interpreted as signals that were necessarily visible or confirmed at those earlier moments.
During Bar Replay, historical opportunities may remain absent until sufficient subsequent price data is available to determine their outcomes.
When take-profit and stop-loss prices are both touched within the same evaluation candle, the selected ambiguity-handling rule determines whether the observation is excluded or classified.
Unresolved or expired candidates are not automatically classified as successful or unsuccessful trades.
The indicator does not execute orders or simulate brokerage fills. Its modeled P&L excludes trading costs, commissions, slippage, execution latency, and other real-world execution constraints.
Historical observations do not establish future predictive accuracy or profitability.
## Intended Use
IFVG + OB Backtesting Assistant is intended for traders conducting historical price-action research, reviewing market behavior around qualifying IFVG and Order Block structures, and investigating how different entry and risk parameters affect observed opportunities.
Its distinguishing functionality is the combination of independent first-active zone detection, preserved historical source-zone geometry, configurable outcome classification, and session-based opportunity analytics within a single charting tool.
All results should be independently evaluated before being incorporated into a trading methodology.
## Overview
IFVG + OB Backtesting Assistant is a historical market-analysis indicator designed to identify, visualize, and evaluate trading opportunities originating from Inverse Fair Value Gaps (IFVGs) and Order Blocks (OBs).
The indicator combines two independent price-action models into a unified research environment, allowing traders to examine historical entry locations, originating price zones, and subsequent price behavior relative to configurable take-profit and stop-loss levels.
Its primary purpose is to facilitate retrospective opportunity analysis, visual backtesting, and systematic research into price-action setups.
## Methodology
**1. First-Active Inverse Fair Value Gap (IFVG)**
The IFVG model monitors the formation of fair value gaps and identifies qualifying inversions when price closes beyond the relevant gap boundary.
Once an eligible inverted zone is established, the model monitors the first qualifying interaction with the selected entry level.
Users can configure entry evaluation at either the zone boundary or Consequent Encroachment (the midpoint of the gap).
The model includes controls for minimum gap size, zone age, consecutive gap qualification, and invalidation.
**2. First-Active Order Block (OB)**
The Order Block model identifies qualifying groups of consecutive directional candles and evaluates subsequent displacement and price interaction.
The model applies configurable conditions involving candle-group structure, directional closes, displacement efficiency, and body size.
Qualifying Order Blocks are monitored for their first eligible entry interaction, subject to the selected validity conditions.
These models operate independently, allowing historical IFVG and OB opportunities to be examined separately or together.
## Historical Opportunity Visualization
The indicator preserves the originating price-zone coordinates associated with each identified opportunity.
Once a candidate reaches its configured take-profit or stop-loss level, the corresponding outcome can be displayed retrospectively at the original entry location.
Available visualization features include:
- Historical IFVG and Order Block source zones.
- Independent winning and losing opportunity displays.
- Optional take-profit and stop-loss visualization.
- Configurable zone boundaries and reference lines.
- Adjustable source-zone extensions.
- Optional price labels and zone identification tags.
Winning opportunities are enabled by default. Losing opportunities can be enabled independently for each model.
Text labels and identification tags are disabled by default to minimize chart congestion.
## Session Configuration
Both models use shared, customizable time windows.
- **State-Tracking Session:** Default **07:00–16:00**, New York time.
- **Entry/Validation Session:** Default **09:30–16:00**, New York time.
The state-tracking session determines when qualifying structures are monitored, while the entry session determines when candidate entries may be registered.
This arrangement supports the analysis of structures formed before the selected execution window.
The indicator is designed for use on the **1-minute chart**.
## Daily Opportunity Analytics
An integrated daily performance table summarizes historical opportunity outcomes separately for bullish and bearish IFVG and OB models.
The table includes:
- Winning opportunities and modeled winning P&L.
- Losing opportunities and modeled losing P&L.
- Combined displayed net P&L.
- Individual model and directional breakdowns.
Users can configure the target distance, stop-loss distance, contract quantity, and monetary value per point.
The calculations represent hypothetical outcomes based on the selected parameters, not verified brokerage transactions.
The table counts retained, displayed outcomes. Disabling opportunity categories or reaching historical drawing limits can affect the reported totals.
## Important Limitations
**This is a retrospective opportunity-analysis indicator, not an automated trading strategy.**
Historical opportunity zones and markers are displayed after their associated outcomes become known. They may be drawn backward onto the original entry candles and must not be interpreted as signals that were necessarily visible or confirmed at those earlier moments.
During Bar Replay, historical opportunities may remain absent until sufficient subsequent price data is available to determine their outcomes.
When take-profit and stop-loss prices are both touched within the same evaluation candle, the selected ambiguity-handling rule determines whether the observation is excluded or classified.
Unresolved or expired candidates are not automatically classified as successful or unsuccessful trades.
The indicator does not execute orders or simulate brokerage fills. Its modeled P&L excludes trading costs, commissions, slippage, execution latency, and other real-world execution constraints.
Historical observations do not establish future predictive accuracy or profitability.
## Intended Use
IFVG + OB Backtesting Assistant is intended for traders conducting historical price-action research, reviewing market behavior around qualifying IFVG and Order Block structures, and investigating how different entry and risk parameters affect observed opportunities.
Its distinguishing functionality is the combination of independent first-active zone detection, preserved historical source-zone geometry, configurable outcome classification, and session-based opportunity analytics within a single charting tool.
All results should be independently evaluated before being incorporated into a trading methodology.

Pernyataan Penyangkalan
Informasi dan publikasi ini tidak dimaksudkan, dan bukan merupakan, saran atau rekomendasi keuangan, investasi, trading, atau jenis lainnya yang diberikan atau didukung oleh TradingView. Baca selengkapnya di Ketentuan Penggunaan.
Pernyataan Penyangkalan
Informasi dan publikasi ini tidak dimaksudkan, dan bukan merupakan, saran atau rekomendasi keuangan, investasi, trading, atau jenis lainnya yang diberikan atau didukung oleh TradingView. Baca selengkapnya di Ketentuan Penggunaan.