Support & Resistance Zones [Buy/Sell Areas]
█ Overview
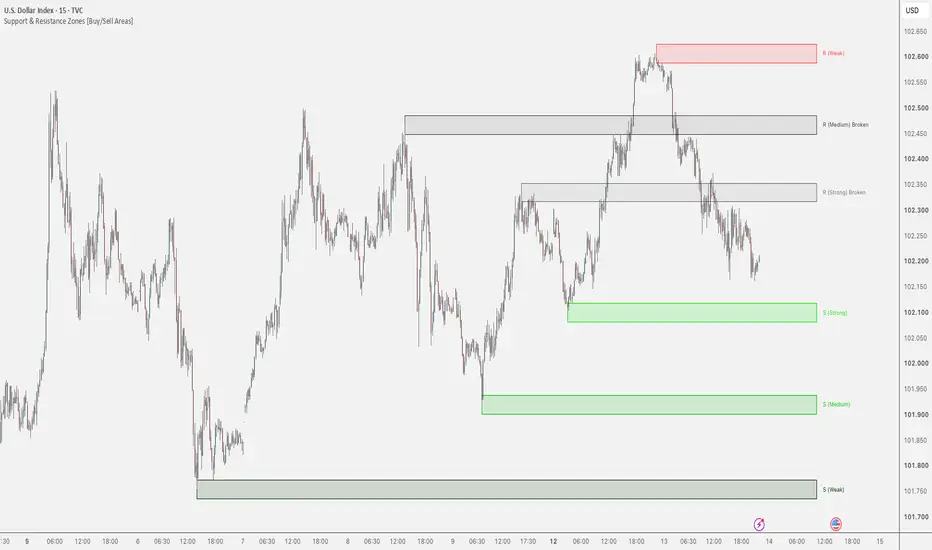
Support & Resistance Zones [Buy/Sell Areas] turns recent swing highs and swing lows into clean, ATR-sized zones, then keeps a running record of what happens to each one.
Instead of a thin line that price rarely respects to the tick, you get a band. Each zone carries a label with a relative activity tier, and a permanent Broken status once price has closed through it, so failed levels stay visible without being confused with active ones.

▌ Zones from swing pivots
Resistance zones (red) come from swing highs. Support zones (green) come from swing lows. Only the latest zones per side are shown (default 3), so the chart stays readable.
▌ Touch count and tier
Each zone tracks how many bars have traded inside it. A relative tier (Strong, Medium, Weak) ranks the zones against each other. Hover a label to see its exact count and rank.
▌ Permanent Broken status
When a bar closes beyond a zone's far edge, the zone turns gray and is marked Broken. It stays that way even if price returns.

█ How It Works
1. Pivot detection
A pivot is a candle whose high (or low) stands out against N bars on each side (default N = 10). A pivot is confirmed N bars after the candle, so zones appear with that delay.
2. Zone construction
Zone = pivot price +/- (ATR x Zone Width). With the defaults (ATR length 14, multiplier 0.5), a zone is about one ATR thick. All zones share the same thickness, based on the current ATR, and it updates as ATR changes.
3. Touch tracking
The count starts at 1 for the pivot candle. After that, every bar whose range overlaps the zone adds 1. Several consecutive bars inside a zone each count, so this measures bars spent in the zone, not separate reactions.
4. Tier ranking
Zones are ranked by touch count among the zones currently shown on that side. The top third is Strong, the bottom third is Weak, and the rest are Medium. This is a relative ranking: with two zones, one is always Strong and the other Weak, even if their counts are close. It does not estimate how likely a zone is to hold.
5. Break logic
Resistance is broken when a bar closes above the top of the zone. Support is broken when a bar closes below the bottom. Support and resistance are tracked independently, and a broken zone does not turn into the opposite type.
6. Zone lifecycle
When a new pivot is confirmed and the Max Zones limit is exceeded, the oldest zone on that side drops off.
█ How to Use
▌ Reading the chart
Color shows age only: brighter zones are newer, darker zones are older. Use labels and tooltips for touch count and rank.
▌ Resistance and support zones
Treat zones as areas to watch for a price reaction, such as a pause, rejection or bounce on a retest. Price may or may not react, and a zone can fail at any time.
▌ Broken zones
Gray zones show where price has already closed through a level. They are kept for reference.
▌ Choosing the pivot length
A higher Pivot Lookback Length gives fewer, more significant zones, confirmed later. A lower one gives more recent structure, confirmed sooner. The indicator uses only the chart's own data, with no higher-timeframe requests, and works on any market and timeframe.
█ Settings
Zone settings
Display
Zone colors
Bright and dark endpoints for support, resistance and broken zones.
█ Alerts
Two alert conditions: Resistance Zone Broken and Support Zone Broken. They follow only the newest pivot on each side and trigger when the close crosses that pivot's price level (the center of the zone, not its outer edge). Because the tracked level changes when a new pivot is confirmed, an alert can also fire when a new pivot replaces the tracked level, not only when price moves through it. Use Once Per Bar Close when creating the alert.
█ Limitations
█ Disclaimer
This indicator is an analytical tool, not financial advice or a guarantee of future results. You are responsible for your own trading decisions.
Support & Resistance Zones [Buy/Sell Areas] turns recent swing highs and swing lows into clean, ATR-sized zones, then keeps a running record of what happens to each one.
Instead of a thin line that price rarely respects to the tick, you get a band. Each zone carries a label with a relative activity tier, and a permanent Broken status once price has closed through it, so failed levels stay visible without being confused with active ones.
▌ Zones from swing pivots
Resistance zones (red) come from swing highs. Support zones (green) come from swing lows. Only the latest zones per side are shown (default 3), so the chart stays readable.
▌ Touch count and tier
Each zone tracks how many bars have traded inside it. A relative tier (Strong, Medium, Weak) ranks the zones against each other. Hover a label to see its exact count and rank.
▌ Permanent Broken status
When a bar closes beyond a zone's far edge, the zone turns gray and is marked Broken. It stays that way even if price returns.
█ How It Works
1. Pivot detection
A pivot is a candle whose high (or low) stands out against N bars on each side (default N = 10). A pivot is confirmed N bars after the candle, so zones appear with that delay.
2. Zone construction
Zone = pivot price +/- (ATR x Zone Width). With the defaults (ATR length 14, multiplier 0.5), a zone is about one ATR thick. All zones share the same thickness, based on the current ATR, and it updates as ATR changes.
3. Touch tracking
The count starts at 1 for the pivot candle. After that, every bar whose range overlaps the zone adds 1. Several consecutive bars inside a zone each count, so this measures bars spent in the zone, not separate reactions.
4. Tier ranking
Zones are ranked by touch count among the zones currently shown on that side. The top third is Strong, the bottom third is Weak, and the rest are Medium. This is a relative ranking: with two zones, one is always Strong and the other Weak, even if their counts are close. It does not estimate how likely a zone is to hold.
5. Break logic
Resistance is broken when a bar closes above the top of the zone. Support is broken when a bar closes below the bottom. Support and resistance are tracked independently, and a broken zone does not turn into the opposite type.
6. Zone lifecycle
When a new pivot is confirmed and the Max Zones limit is exceeded, the oldest zone on that side drops off.
█ How to Use
▌ Reading the chart
Color shows age only: brighter zones are newer, darker zones are older. Use labels and tooltips for touch count and rank.
▌ Resistance and support zones
Treat zones as areas to watch for a price reaction, such as a pause, rejection or bounce on a retest. Price may or may not react, and a zone can fail at any time.
▌ Broken zones
Gray zones show where price has already closed through a level. They are kept for reference.
▌ Choosing the pivot length
A higher Pivot Lookback Length gives fewer, more significant zones, confirmed later. A lower one gives more recent structure, confirmed sooner. The indicator uses only the chart's own data, with no higher-timeframe requests, and works on any market and timeframe.
█ Settings
Zone settings
- Pivot Lookback Length (default 10): bars checked on each side of a pivot.
- ATR Length (default 14) and Zone Width x ATR (default 0.5): zone thickness.
- Max Zones per Side (default 3): how many zones are kept.
Display
- Zone Extension (default 30 bars): how far boxes project to the right.
- Show Zone Labels: S/R label with tier. Tooltips give exact counts.
Zone colors
Bright and dark endpoints for support, resistance and broken zones.
█ Alerts
Two alert conditions: Resistance Zone Broken and Support Zone Broken. They follow only the newest pivot on each side and trigger when the close crosses that pivot's price level (the center of the zone, not its outer edge). Because the tracked level changes when a new pivot is confirmed, an alert can also fire when a new pivot replaces the tracked level, not only when price moves through it. Use Once Per Bar Close when creating the alert.
█ Limitations
- Zones are drawn from the pivot candle, but were not known until N bars later.
- Only the current state is drawn. Scrolling back does not show earlier zones.
- The latest pivots are shown regardless of how far they are from current price.
- On a live bar, touch counts and break status can change until the bar closes.
█ Disclaimer
This indicator is an analytical tool, not financial advice or a guarantee of future results. You are responsible for your own trading decisions.

🔻🔻🔻🔻🔻🔻🔻🔻🔻🔻🔻🔻🔻🔻🔻🔻🔻🔻🔻
📊 Free Tools: minimalisttrading.com/tools
👨🏫 Free Education: minimalisttrading.com/learn
📈 Trading Indicators: minimalisttrading.com
🔺🔺🔺🔺🔺🔺🔺🔺🔺🔺🔺🔺🔺🔺🔺🔺🔺🔺🔺
📊 Free Tools: minimalisttrading.com/tools
👨🏫 Free Education: minimalisttrading.com/learn
📈 Trading Indicators: minimalisttrading.com
🔺🔺🔺🔺🔺🔺🔺🔺🔺🔺🔺🔺🔺🔺🔺🔺🔺🔺🔺
Pernyataan Penyangkalan
Informasi dan publikasi ini tidak dimaksudkan, dan bukan merupakan, saran atau rekomendasi keuangan, investasi, trading, atau jenis lainnya yang diberikan atau didukung oleh TradingView. Baca selengkapnya di Ketentuan Penggunaan.
🔻🔻🔻🔻🔻🔻🔻🔻🔻🔻🔻🔻🔻🔻🔻🔻🔻🔻🔻
📊 Free Tools: minimalisttrading.com/tools
👨🏫 Free Education: minimalisttrading.com/learn
📈 Trading Indicators: minimalisttrading.com
🔺🔺🔺🔺🔺🔺🔺🔺🔺🔺🔺🔺🔺🔺🔺🔺🔺🔺🔺
📊 Free Tools: minimalisttrading.com/tools
👨🏫 Free Education: minimalisttrading.com/learn
📈 Trading Indicators: minimalisttrading.com
🔺🔺🔺🔺🔺🔺🔺🔺🔺🔺🔺🔺🔺🔺🔺🔺🔺🔺🔺
Pernyataan Penyangkalan
Informasi dan publikasi ini tidak dimaksudkan, dan bukan merupakan, saran atau rekomendasi keuangan, investasi, trading, atau jenis lainnya yang diberikan atau didukung oleh TradingView. Baca selengkapnya di Ketentuan Penggunaan.