OPEN-SOURCE SCRIPT
Volume Weighted Outlier Bands [Pineify]
Overview
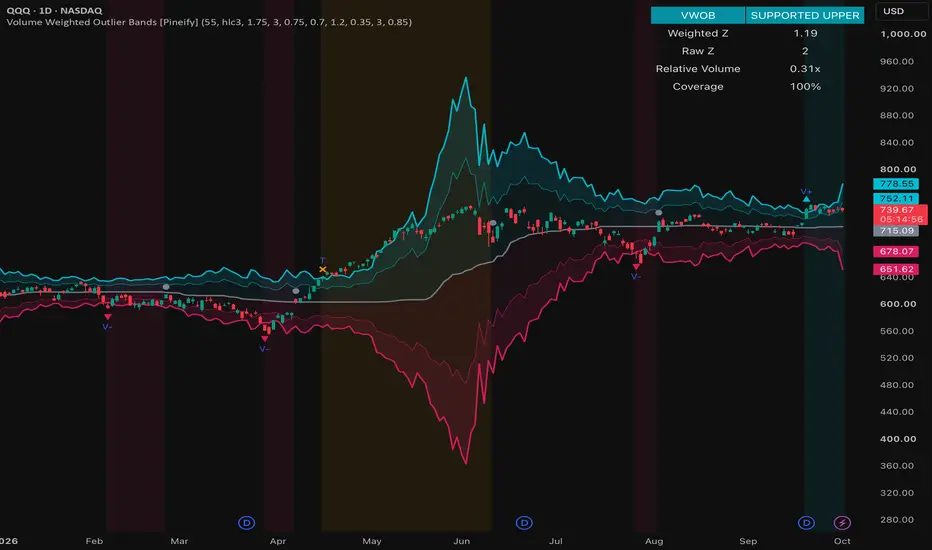
This robust deviation overlay tests whether relative participation supports an unusual move. A prior-window median and MAD set the baseline; a two-level field narrows on strong volume and widens on thin volume.
Problem Definition
Standard-deviation bands treat every observation alike. A low-volume wick and a high-volume close can receive the same z-score despite different participation. Mean and deviation also move toward the outlier, changing the yardstick during the event. Fixed bands may hide a supported displacement or exaggerate a thin spike. The task is not to predict reversion, but to separate robust price distance from participation evidence.
Design Rationale
The preceding window's median resists one unusual price, while median absolute deviation supplies a matching scale. Excluding the current bar preserves one comparison. A volume-weighted average was rejected because it moves the center without classifying participation. Current volume is instead divided by prior median volume, clipped, and square-rooted. This bounded factor scales residual evidence and displayed thresholds without letting one volume burst collapse the field. A coverage gate rejects incomplete histories.
Key Features
How It Works
Prior completed prices define the median. Their median absolute distance, multiplied by 1.4826, defines robust scale; a near-zero result blocks analysis.
Prior median volume and usable-sample coverage form the participation baseline. Current volume divided by that median is clipped and square-rooted. Raw robust Z is price distance divided by scale; weighted Z multiplies it by this weight.
Thresholds return to price space by dividing scale distance by the same weight. High participation narrows required distance; thin participation widens it. A supported event needs weighted Z beyond the outer threshold and volume above its floor. A thin spike needs raw Z beyond that threshold and volume below its ceiling. Confirmed state persists until another event or a weighted center return. Warm-up, missing volume, low coverage, or degenerate MAD yields no classification. Open bars can move diagnostics, but not states or alerts.
How Multiple Indicators Work Together
The components form one chain: median defines location, MAD defines comparable distance, median volume defines normal participation, and the bounded weight links volume to residual. Confirmed memory preserves event type. Removing any stage changes the question: distance becomes unstable, loses scale, collapses thin and supported moves, or treats intrabar touches as durable.
Trading Ideas and Insights
Read the field before markers. Cyan and magenta show participation-adjusted upper and lower distance. Contraction on strong volume means a moderate move carries more participation evidence; expansion on thin volume demands a larger move. Supported states can frame acceptance review and orange thin states can frame rejection review. Neither predicts the next return, and an outlier is not automatically a reversal setup.
Unique Aspects
Relative volume does not merely recolor a fixed envelope. It changes weighted Z and maps the thresholds back to dynamic price boundaries. Raw Z remains separate, so a large thin-volume spike is visible even when weighted evidence discounts it. The model preserves two questions—how unusual is price, and how much participation supports it—then stores their confirmed outcome.
How to Use
Customization
Lookback changes memory and cost. Context and Outlier thresholds set visual and event distance; Center Return controls reset. Thin Ceiling and Supported Floor separate participation classes, not universal truths. Weight limits cap field expansion and contraction. Minimum Coverage rejects sparse data. Display switches hide secondary layers without changing calculations or alerts.
Assumptions and Limitations
Volume must be meaningful and comparable across the window. Tick volume, synthetic symbols, session changes, contract rolls, missing bars, and unusual auctions can break that assumption. Median and MAD lag regime shifts; near-zero MAD suppresses output. Inputs or loaded history recalculate past values.
Price and volume evolve intrabar, so bands, scores, and dashboard values can change before close. States, markers, and alerts update only on confirmed bars. The model sees aggregate volume, not bid/ask flow, liquidity, or execution. It supplies no target, stop, sizing, backtest, probability, profitability claim, or guarantee of reversion. Gaps may cross several levels, and clipping ignores volume magnitude beyond its limits.
Conclusion
The overlay keeps robust price distance and participation evidence distinct, then reconnects them through a price-space field and confirmed memory.
This robust deviation overlay tests whether relative participation supports an unusual move. A prior-window median and MAD set the baseline; a two-level field narrows on strong volume and widens on thin volume.
Problem Definition
Standard-deviation bands treat every observation alike. A low-volume wick and a high-volume close can receive the same z-score despite different participation. Mean and deviation also move toward the outlier, changing the yardstick during the event. Fixed bands may hide a supported displacement or exaggerate a thin spike. The task is not to predict reversion, but to separate robust price distance from participation evidence.
Design Rationale
The preceding window's median resists one unusual price, while median absolute deviation supplies a matching scale. Excluding the current bar preserves one comparison. A volume-weighted average was rejected because it moves the center without classifying participation. Current volume is instead divided by prior median volume, clipped, and square-rooted. This bounded factor scales residual evidence and displayed thresholds without letting one volume burst collapse the field. A coverage gate rejects incomplete histories.
Key Features
- Prior-window median center and MAD scale.
- Relative-volume weighting of score and price bands.
- Confirmed supported-outlier and thin-spike states.
- Optional markers, wash, bar color, and dashboard.
- Confirmed return-to-center alert.
How It Works
Prior completed prices define the median. Their median absolute distance, multiplied by 1.4826, defines robust scale; a near-zero result blocks analysis.
Prior median volume and usable-sample coverage form the participation baseline. Current volume divided by that median is clipped and square-rooted. Raw robust Z is price distance divided by scale; weighted Z multiplies it by this weight.
Thresholds return to price space by dividing scale distance by the same weight. High participation narrows required distance; thin participation widens it. A supported event needs weighted Z beyond the outer threshold and volume above its floor. A thin spike needs raw Z beyond that threshold and volume below its ceiling. Confirmed state persists until another event or a weighted center return. Warm-up, missing volume, low coverage, or degenerate MAD yields no classification. Open bars can move diagnostics, but not states or alerts.
How Multiple Indicators Work Together
The components form one chain: median defines location, MAD defines comparable distance, median volume defines normal participation, and the bounded weight links volume to residual. Confirmed memory preserves event type. Removing any stage changes the question: distance becomes unstable, loses scale, collapses thin and supported moves, or treats intrabar touches as durable.
Trading Ideas and Insights
Read the field before markers. Cyan and magenta show participation-adjusted upper and lower distance. Contraction on strong volume means a moderate move carries more participation evidence; expansion on thin volume demands a larger move. Supported states can frame acceptance review and orange thin states can frame rejection review. Neither predicts the next return, and an outlier is not automatically a reversal setup.
Unique Aspects
Relative volume does not merely recolor a fixed envelope. It changes weighted Z and maps the thresholds back to dynamic price boundaries. Raw Z remains separate, so a large thin-volume spike is visible even when weighted evidence discounts it. The model preserves two questions—how unusual is price, and how much participation supports it—then stores their confirmed outcome.
How to Use
- Choose a lookback representing the local distribution and intended horizon.
- Verify consistent volume and wait for coverage and warm-up gates.
- Read center, context, and outer bands as a hierarchy; use markers for confirmed type.
- Configure supported, thin-spike, or center-return alerts at the desired frequency.
- Compare several regimes before assigning discretionary meaning.
Customization
Lookback changes memory and cost. Context and Outlier thresholds set visual and event distance; Center Return controls reset. Thin Ceiling and Supported Floor separate participation classes, not universal truths. Weight limits cap field expansion and contraction. Minimum Coverage rejects sparse data. Display switches hide secondary layers without changing calculations or alerts.
Assumptions and Limitations
Volume must be meaningful and comparable across the window. Tick volume, synthetic symbols, session changes, contract rolls, missing bars, and unusual auctions can break that assumption. Median and MAD lag regime shifts; near-zero MAD suppresses output. Inputs or loaded history recalculate past values.
Price and volume evolve intrabar, so bands, scores, and dashboard values can change before close. States, markers, and alerts update only on confirmed bars. The model sees aggregate volume, not bid/ask flow, liquidity, or execution. It supplies no target, stop, sizing, backtest, probability, profitability claim, or guarantee of reversion. Gaps may cross several levels, and clipping ignores volume magnitude beyond its limits.
Conclusion
The overlay keeps robust price distance and participation evidence distinct, then reconnects them through a price-space field and confirmed memory.
Skrip open-source
Dengan semangat TradingView yang sesungguhnya, pembuat skrip ini telah menjadikannya sebagai sumber terbuka, sehingga para trader dapat meninjau dan memverifikasi fungsinya. Salut untuk penulisnya! Meskipun Anda dapat menggunakannya secara gratis, perlu diingat bahwa penerbitan ulang kode ini tunduk pada Tata Tertib kami.

🚀🚀🚀 Pineify - pineify.app
Essential Toolkit for Every Trader
- AI Pine Script Generator
- Finance AI Agent
- AI Stock Picker
- Pine Script Visual Editor
- Invited indicators
- Strategy Optimizer
- Trading Journal
- Backtest Report
Essential Toolkit for Every Trader
- AI Pine Script Generator
- Finance AI Agent
- AI Stock Picker
- Pine Script Visual Editor
- Invited indicators
- Strategy Optimizer
- Trading Journal
- Backtest Report
Pernyataan Penyangkalan
Informasi dan publikasi ini tidak dimaksudkan, dan bukan merupakan, saran atau rekomendasi keuangan, investasi, trading, atau jenis lainnya yang diberikan atau didukung oleh TradingView. Baca selengkapnya di Ketentuan Penggunaan.
Skrip open-source
Dengan semangat TradingView yang sesungguhnya, pembuat skrip ini telah menjadikannya sebagai sumber terbuka, sehingga para trader dapat meninjau dan memverifikasi fungsinya. Salut untuk penulisnya! Meskipun Anda dapat menggunakannya secara gratis, perlu diingat bahwa penerbitan ulang kode ini tunduk pada Tata Tertib kami.
🚀🚀🚀 Pineify - pineify.app
Essential Toolkit for Every Trader
- AI Pine Script Generator
- Finance AI Agent
- AI Stock Picker
- Pine Script Visual Editor
- Invited indicators
- Strategy Optimizer
- Trading Journal
- Backtest Report
Essential Toolkit for Every Trader
- AI Pine Script Generator
- Finance AI Agent
- AI Stock Picker
- Pine Script Visual Editor
- Invited indicators
- Strategy Optimizer
- Trading Journal
- Backtest Report
Pernyataan Penyangkalan
Informasi dan publikasi ini tidak dimaksudkan, dan bukan merupakan, saran atau rekomendasi keuangan, investasi, trading, atau jenis lainnya yang diberikan atau didukung oleh TradingView. Baca selengkapnya di Ketentuan Penggunaan.